An octave/MATLAB RC circuit example with Fourier series
Jump to navigation
Jump to search
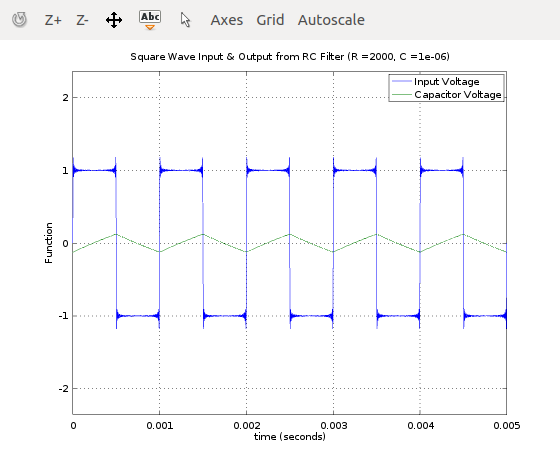
This octave/MATLAB script shows the current response of a series RC circuit to a voltage square wave input. You can easily modify the input to any periodic function if you know the Fourier series for it.

clf;
T=1/1000;
t=0:.001*T:5*T;
R=2000;
C=1e-6;
M=101;
vin=0;
current =0;
for n=-M:2:M,
	vin = vin+2/(j*pi*n)*exp(j*2*pi*n/T*t); % Add your code here to change vin.
  wn=2*pi*n/T;
	current = current+ 2/(j*pi*n)*exp(j*2*pi*n/T*t)*j*wn*C/(1+j*wn*R*C);
end
vc=vin-R*current;
plot(t,vin,t,vc)
title(strcat('Square Wave Input & Output from RC Filter (R = ',num2str(R),', C = ',
num2str(C),')'))
xlabel('time (seconds)')
ylabel('Function')
grid on;
axis([0,max(t),-2*max(abs(vin)),2*max(abs(vin))])
legend('Input Voltage','Capacitor Voltage')
%print("LowPass.png","-dpng")  % Prints the plot to a png file called LowPass.png
