Hw3
Jump to navigation
Jump to search
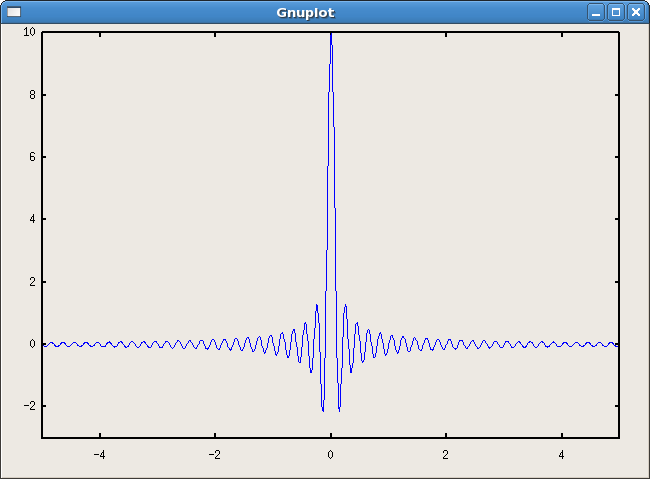
Show graphically that
You can either type this code straight into octave or matlab, or you can save it as a [name_of_file].m and loading it to the software.
octave:1> t= -5:.01:5;
octave:2> f=t;
octave:3> [ff,tt]=meshgrid(f,t);
octave:4> r=exp(j*2*pi.*ff.*tt);
octave:5> delta=trapz(r)*.01;
octave:6> one1=.01*trapz(delta);
octave:7> plot(t,delta);
This is what the graph looks like.

