File list
Jump to navigation
Jump to search
This special page shows all uploaded files.
| Date | Name | Thumbnail | Size | User | Description | Versions |
|---|---|---|---|---|---|---|
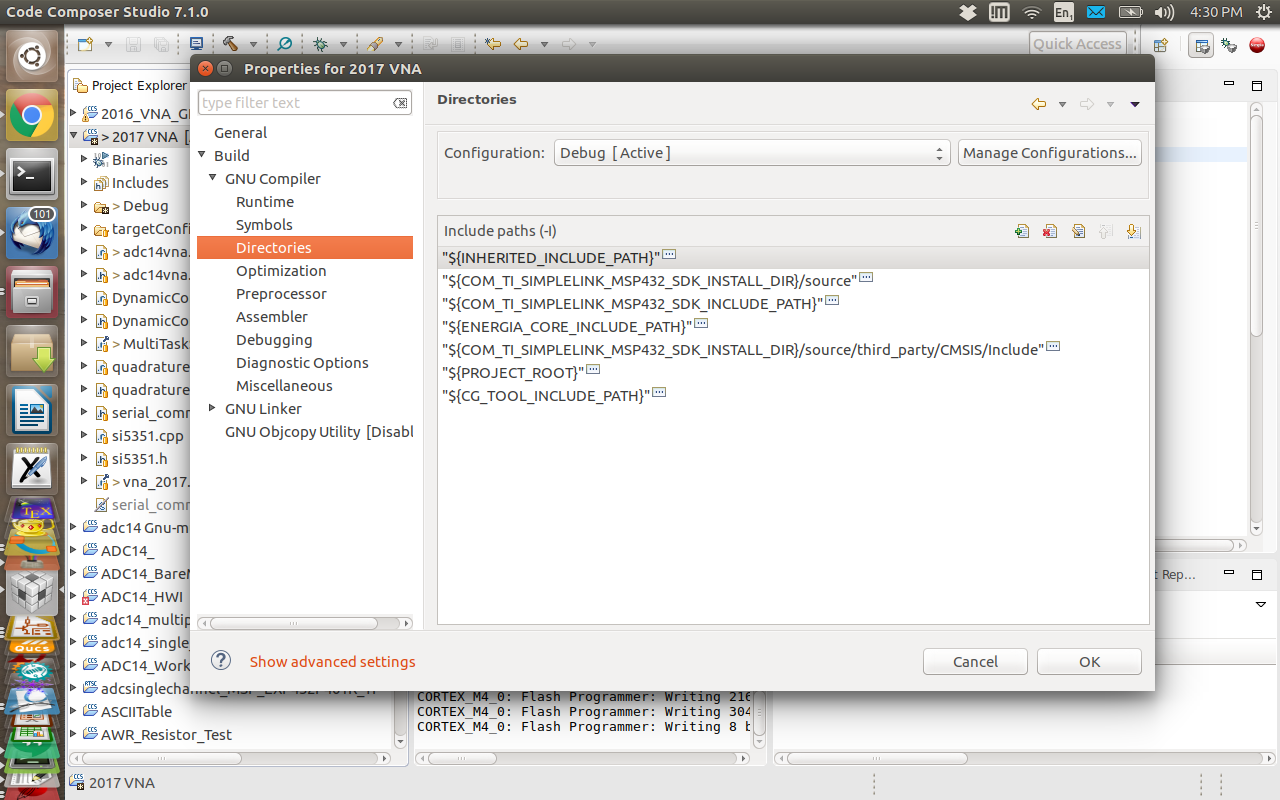
| 16:34, 23 May 2017 | Ccsv7 directories.png (file) |  |
275 KB | Frohro | 1 | |
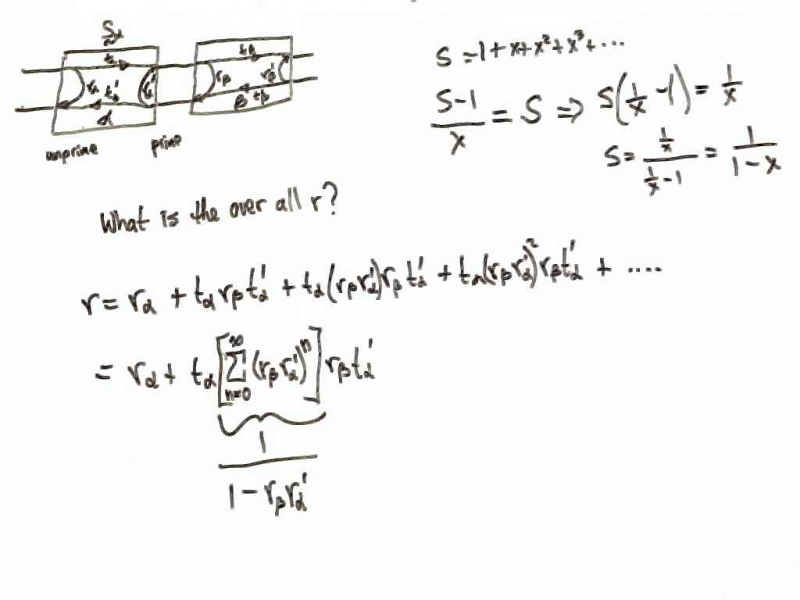
| 08:38, 22 May 2017 | R.jpg (file) |  |
183 KB | Frohro | 1 | |
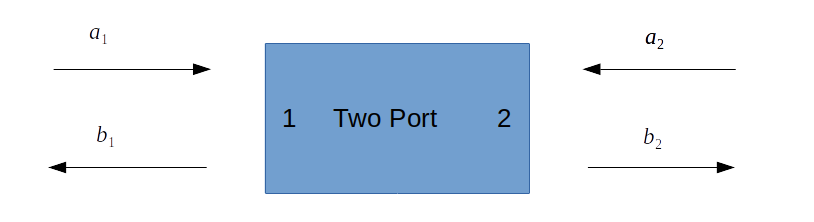
| 22:25, 17 May 2017 | S Parameters.png (file) | 8 KB | Frohro | 1 | ||
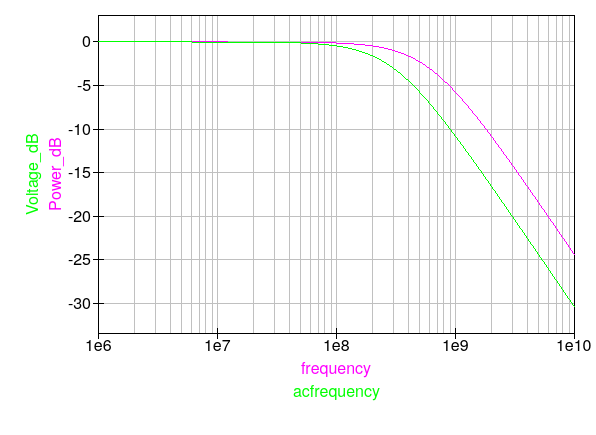
| 07:11, 17 May 2017 | 300MHz Lumped LPF res.png (file) |  |
14 KB | Frohro | 1 | |
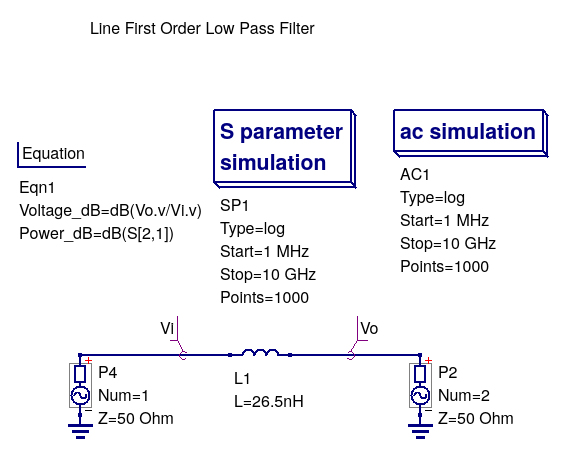
| 07:09, 17 May 2017 | 300MHz Lumped LPF.png (file) |  |
33 KB | Frohro | 1 | |
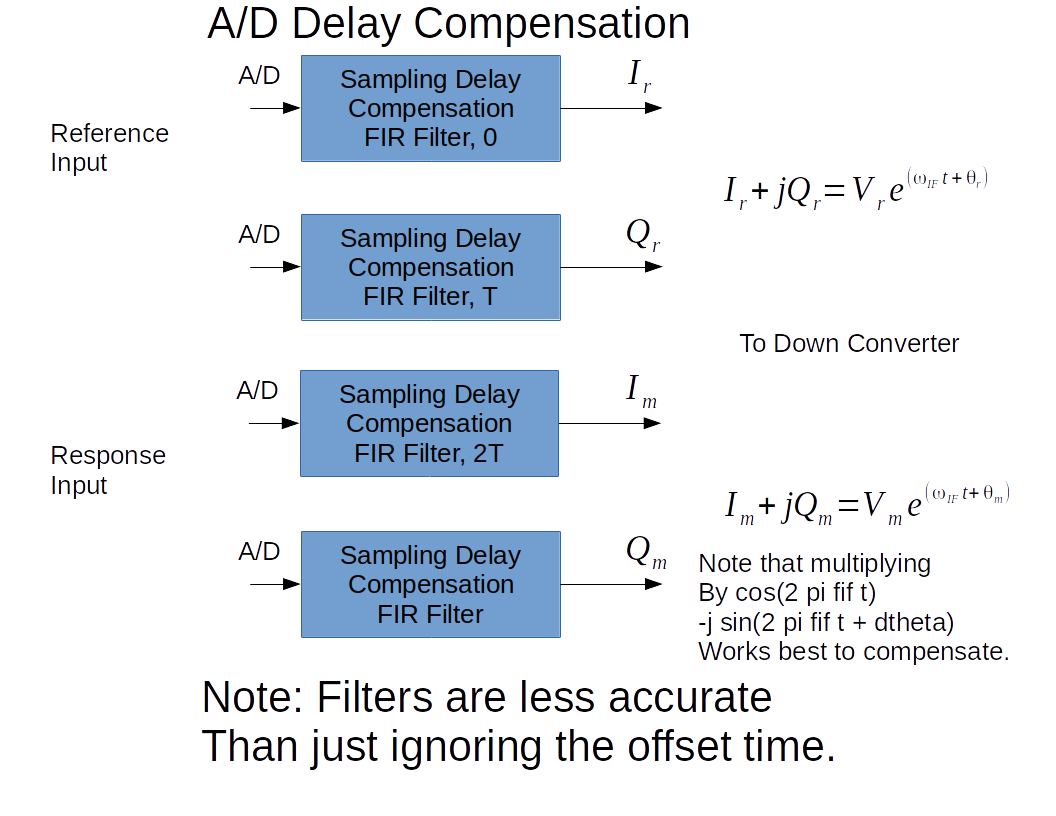
| 07:27, 28 April 2017 | VNA Software Diagram.png (file) |  |
224 KB | Frohro | 1 | |
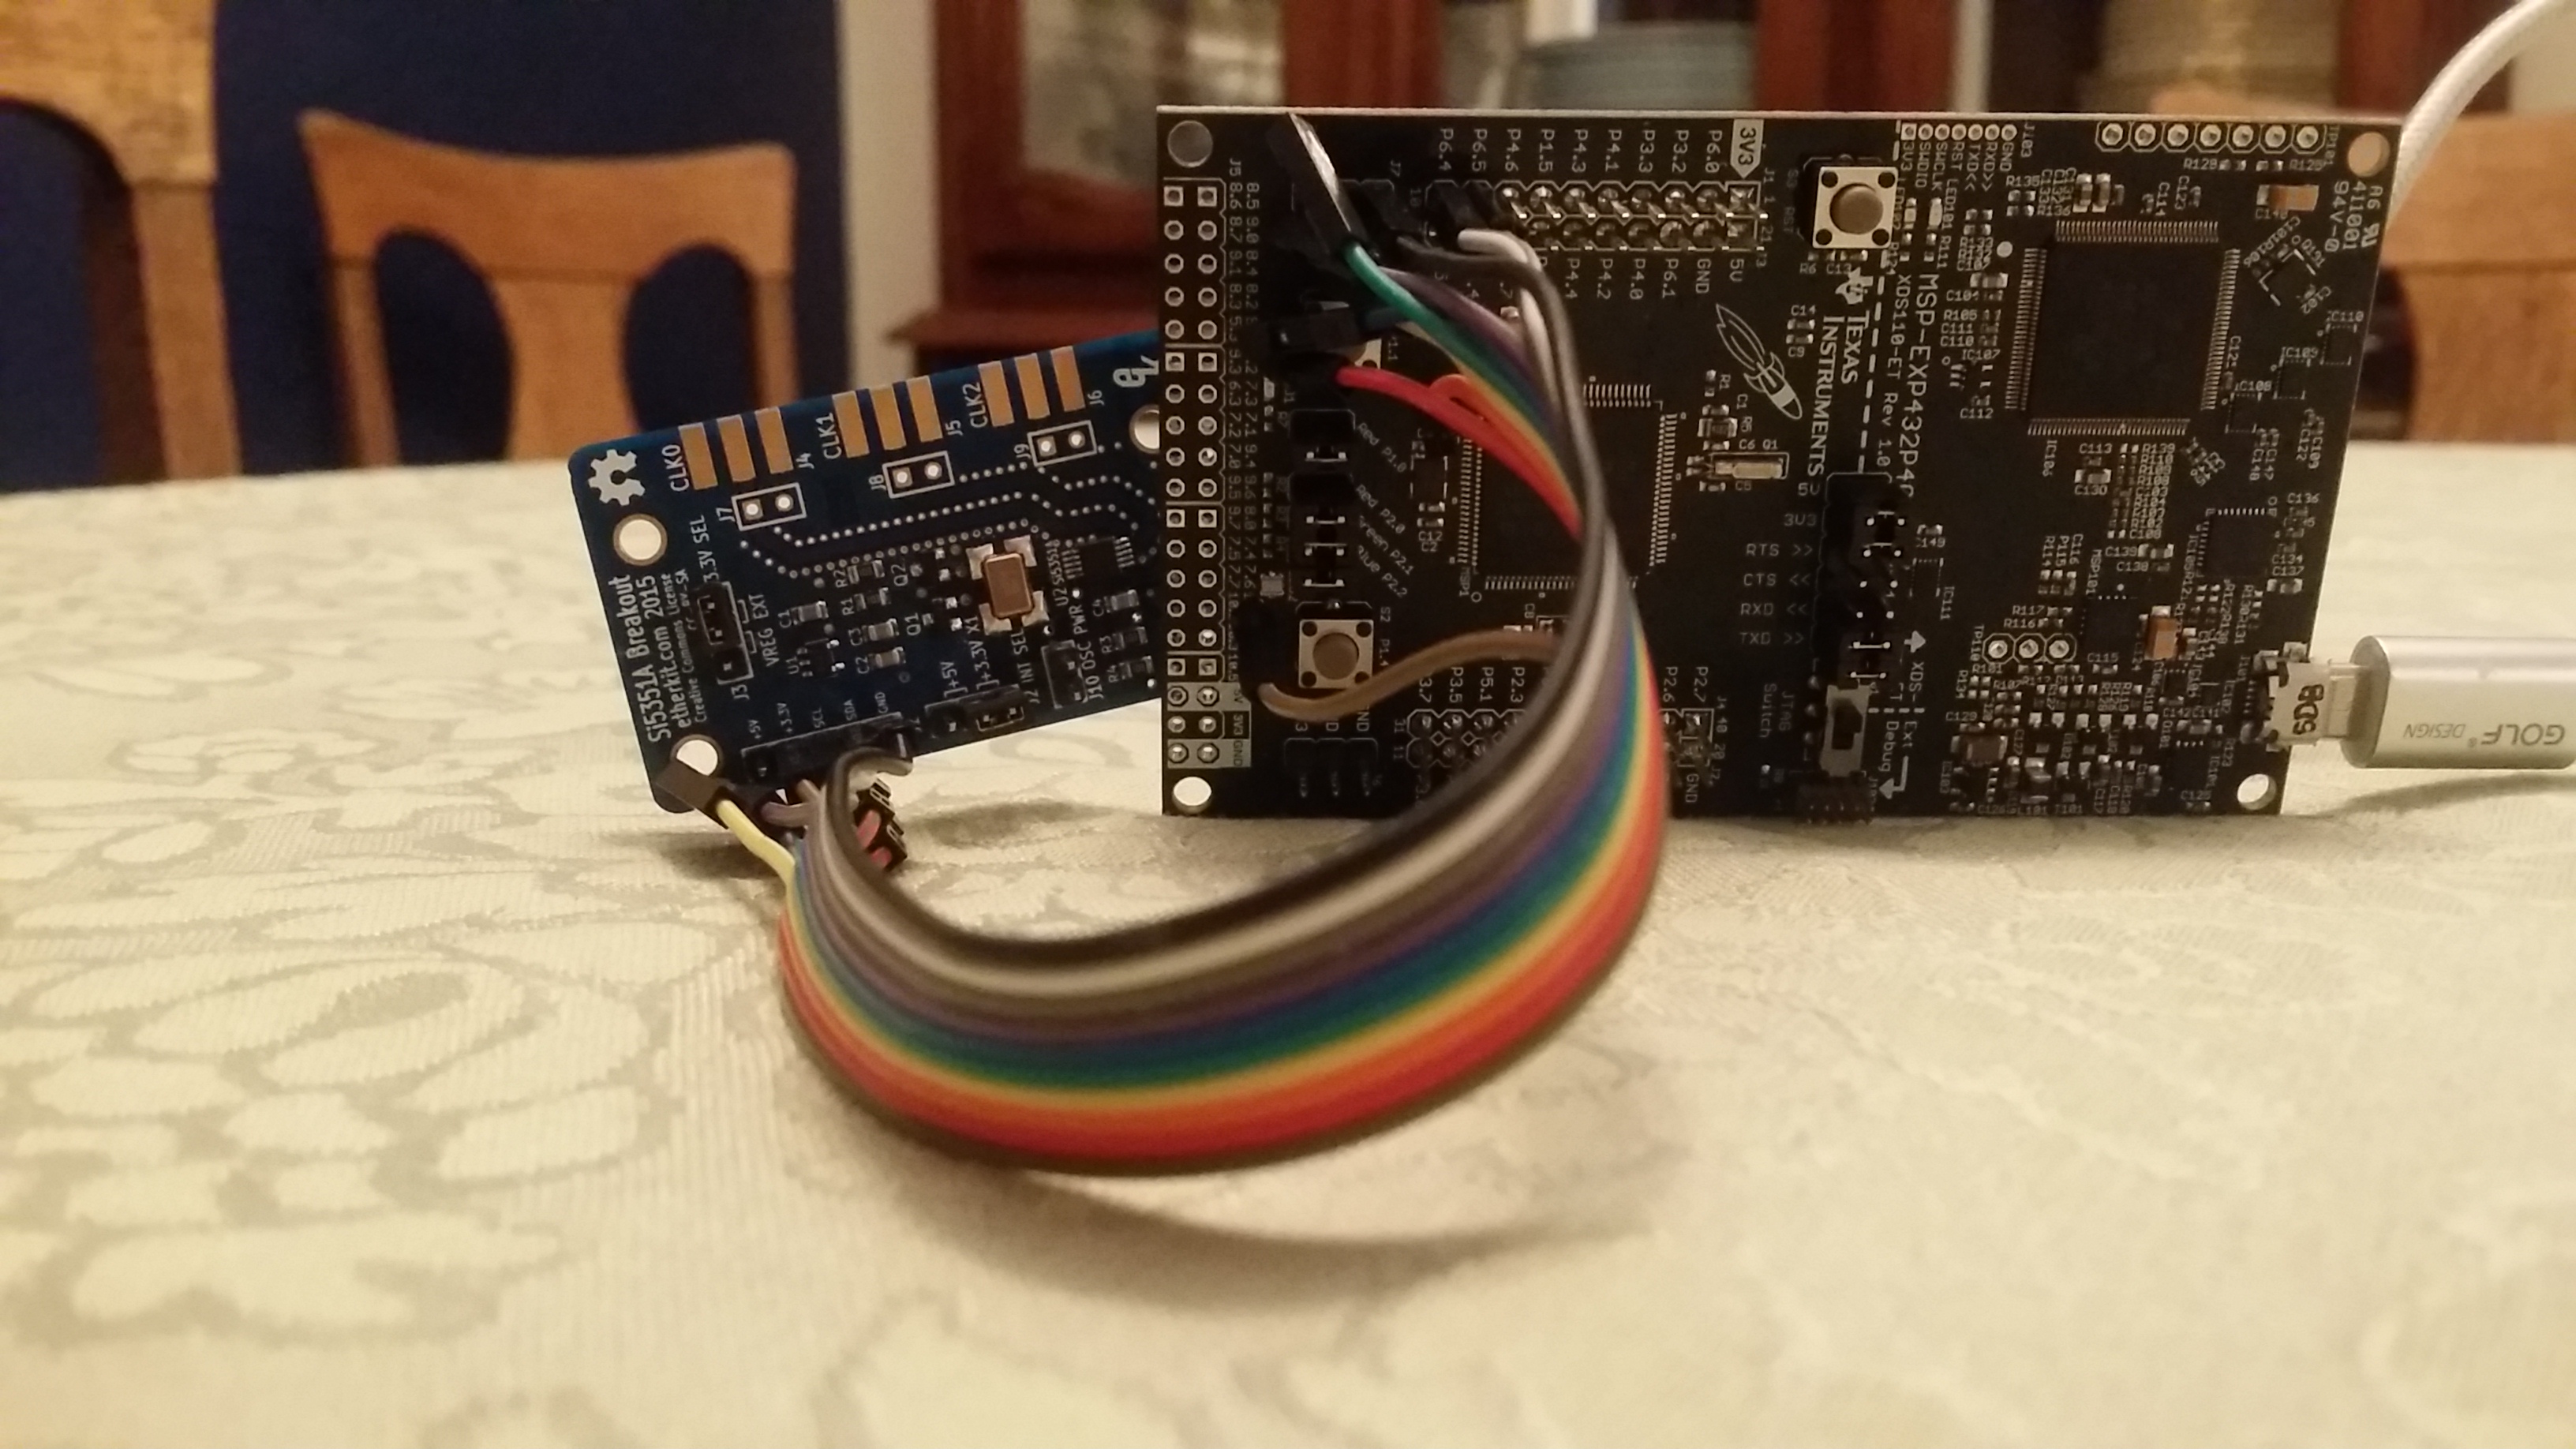
| 07:10, 28 April 2017 | Test circuit.jpg (file) |  |
1.38 MB | Frohro | This is the test circuit I used to get the software going. | 1 |
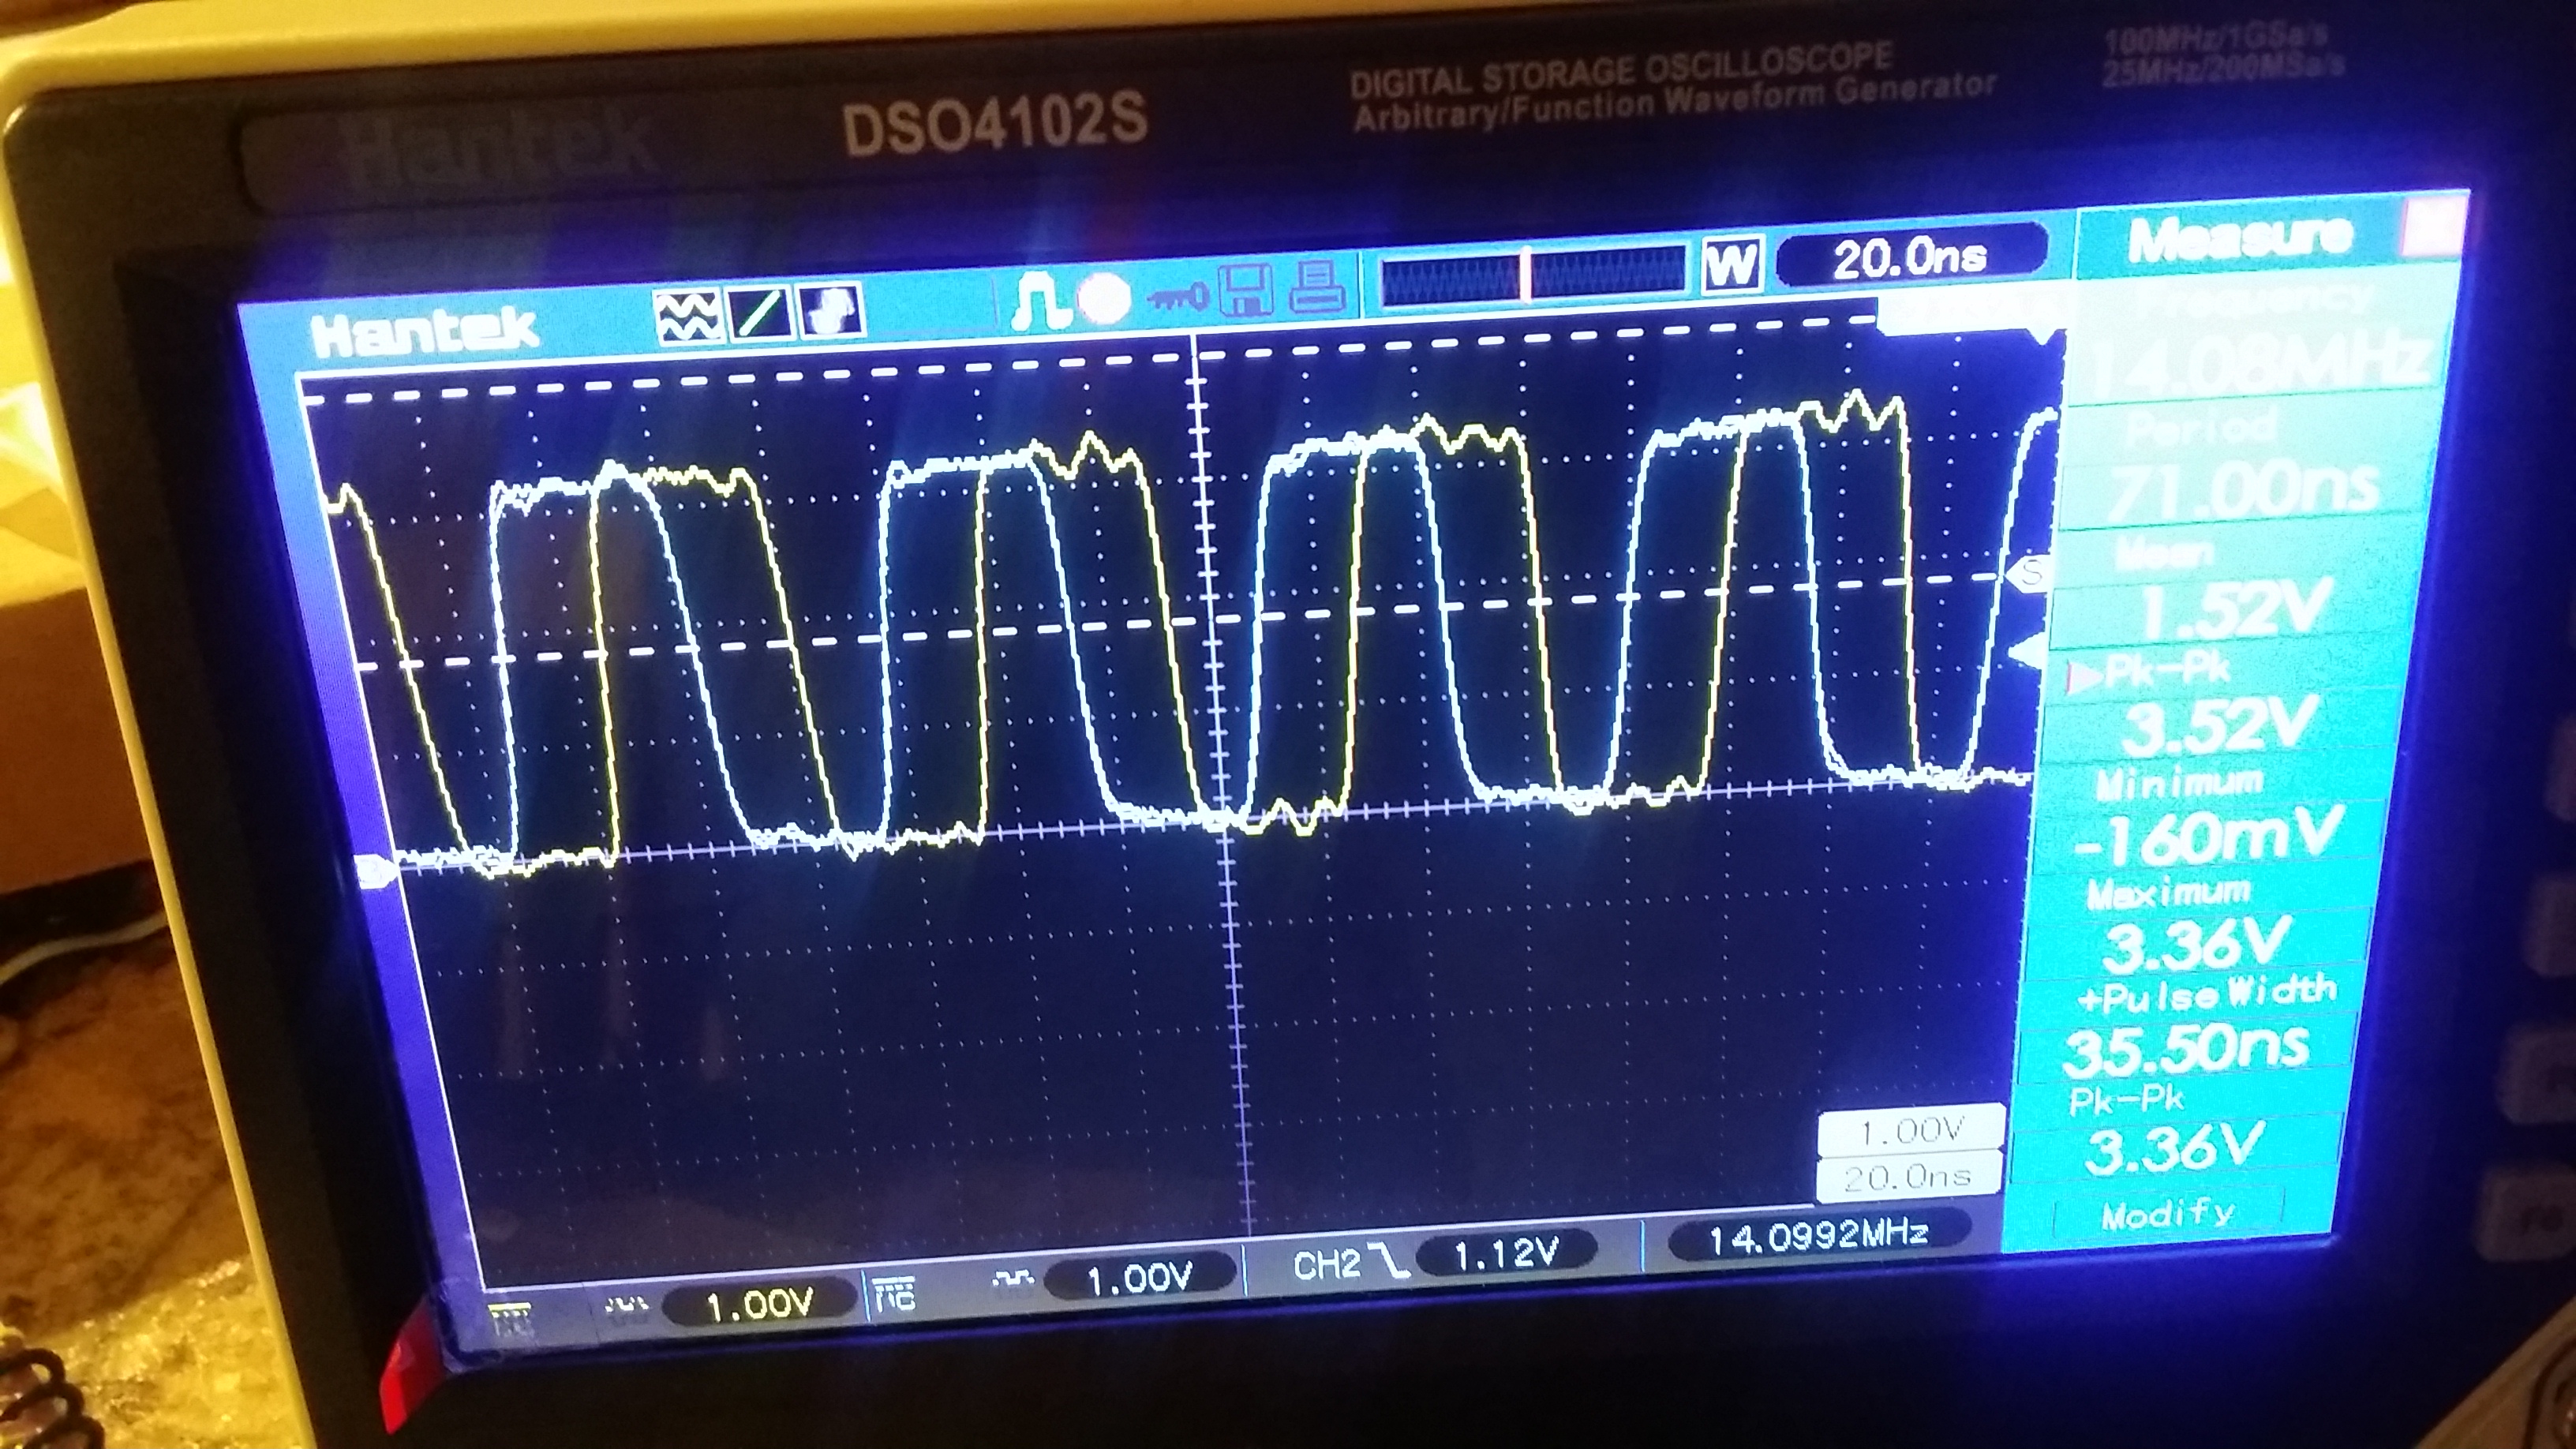
| 07:01, 28 April 2017 | Lo results.jpg (file) |  |
1.7 MB | Frohro | This shows the working output of an SI5351A. | 1 |
| 14:16, 7 April 2017 | Driver1.zip (file) | 335 KB | Frohro | 2 | ||
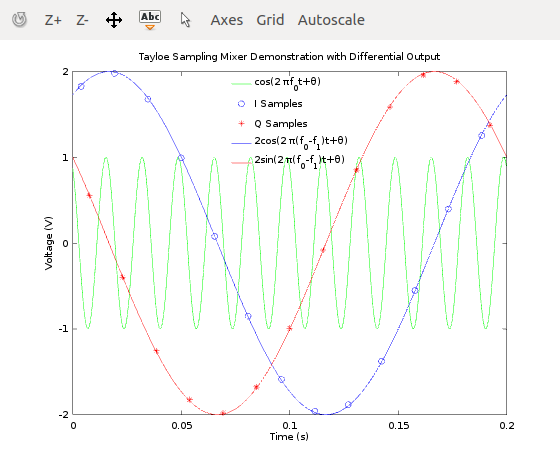
| 14:35, 5 April 2017 | Tayloe mixer.png (file) |  |
24 KB | Frohro | This shows a Tayloe mixer working on a 60 Hz cosine wave with 30 degrees of phase delay mixing with a 65 Hz local oscillator signal. | 1 |
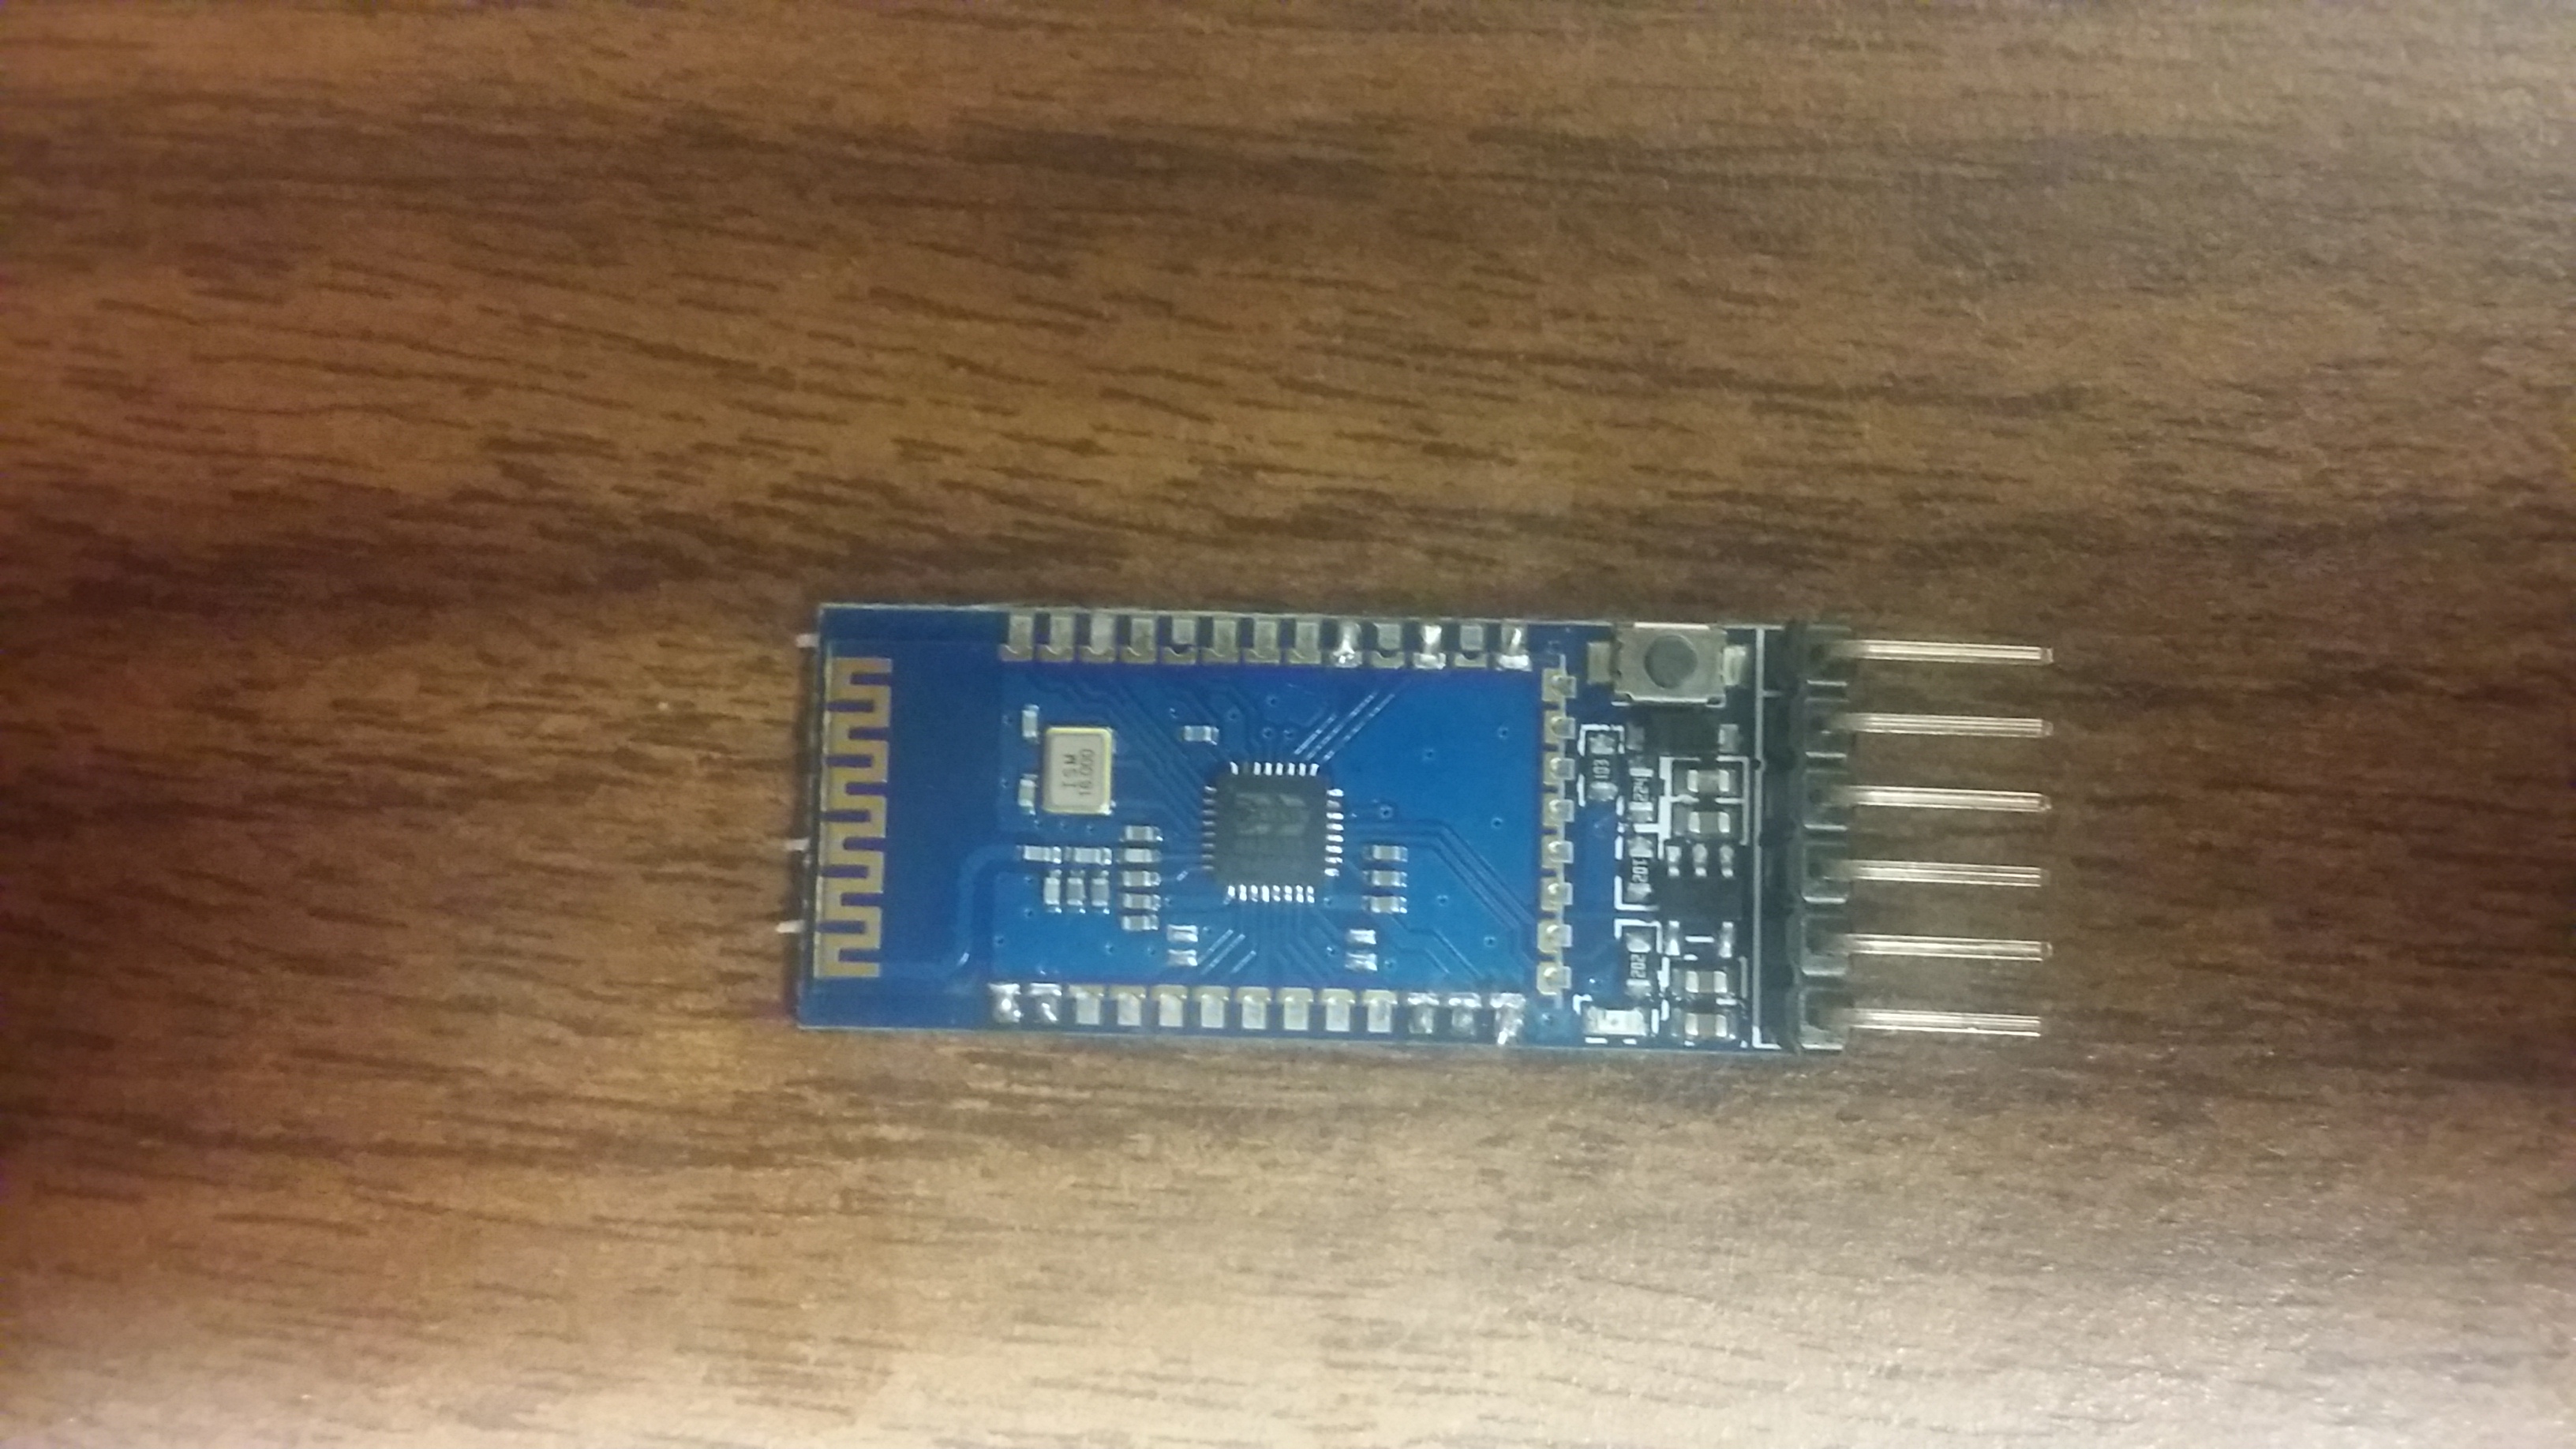
| 18:43, 15 November 2016 | Bluetooth Carrier.jpg (file) |  |
1.42 MB | Frohro | This shows how the BL-04A bluetooth module is soldered to the carrier board. | 1 |
| 21:37, 2 November 2016 | Nyquist.png (file) |  |
16 KB | Frohro | 1 | |
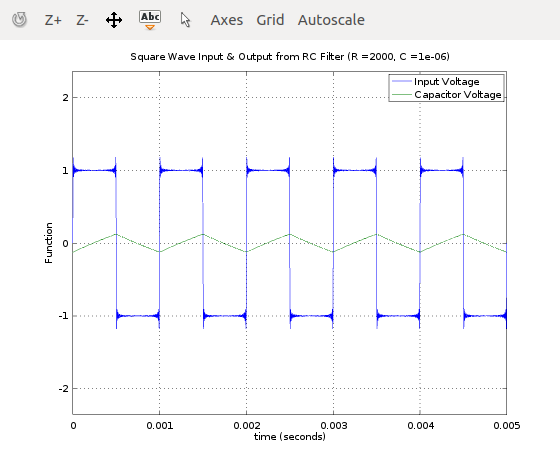
| 20:27, 2 November 2016 | RC-Series.png (file) |  |
3 KB | Frohro | 1 | |
| 20:21, 2 November 2016 | RC-Circuit-Response.png (file) |  |
18 KB | Frohro | 1 | |
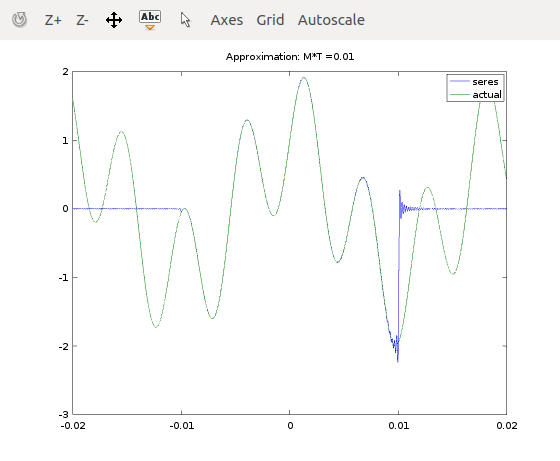
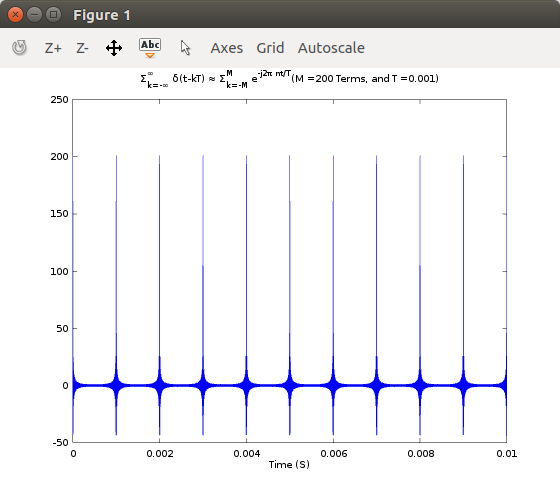
| 16:51, 2 November 2016 | Sampling Function.png (file) |  |
19 KB | Frohro | 3 | |
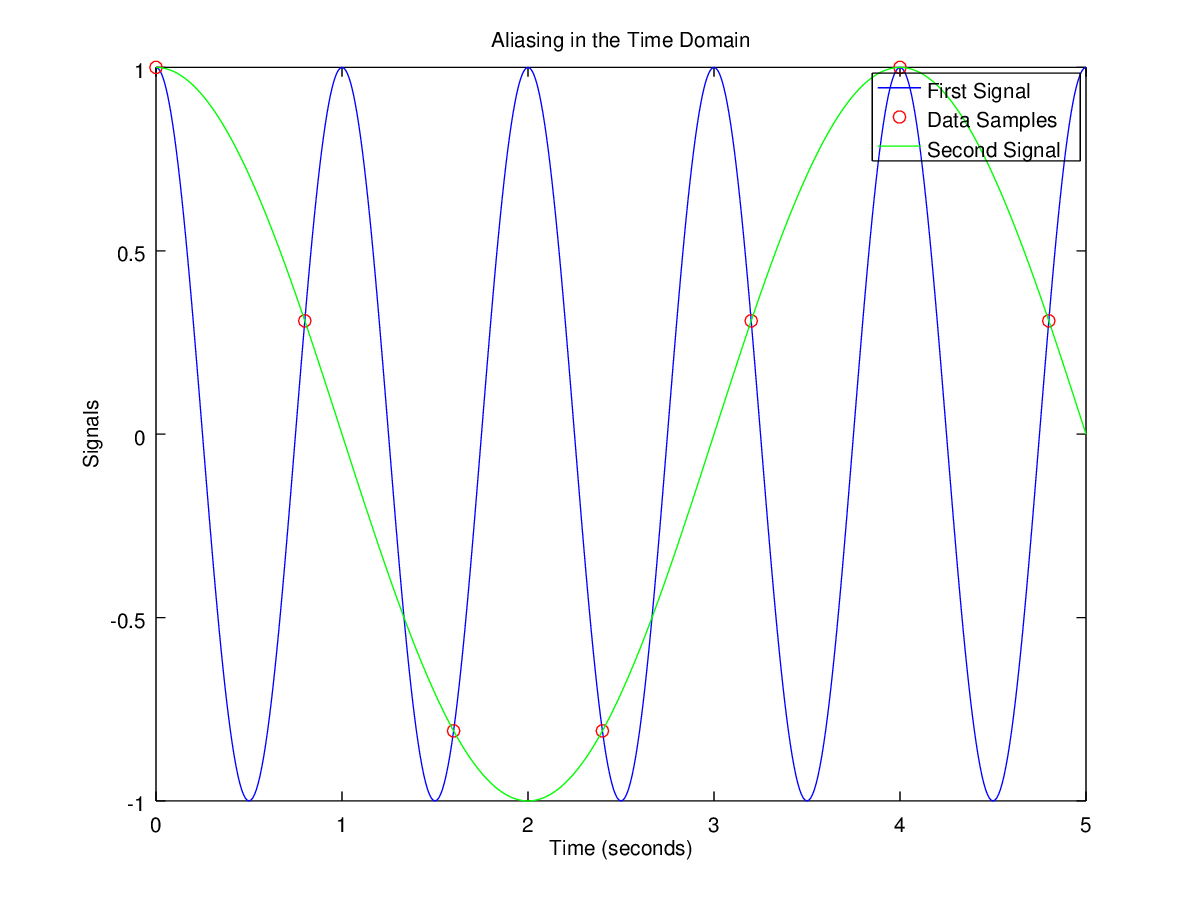
| 16:08, 2 November 2016 | Sinewaves aliasing.png (file) |  |
50 KB | Frohro | 1 | |
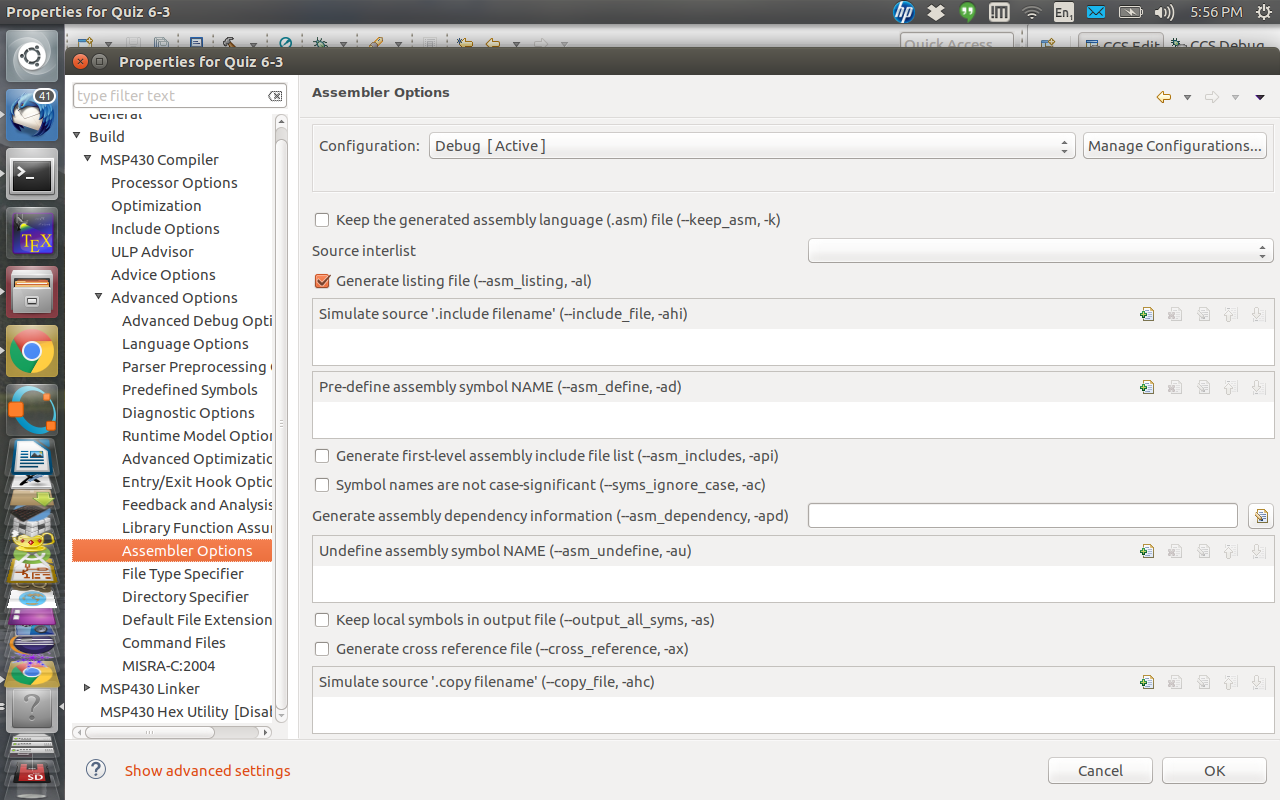
| 18:00, 1 November 2016 | Assembly-listing-option.png (file) |  |
249 KB | Frohro | Showing how to get CCSV6 to give you an assembly listing. | 1 |
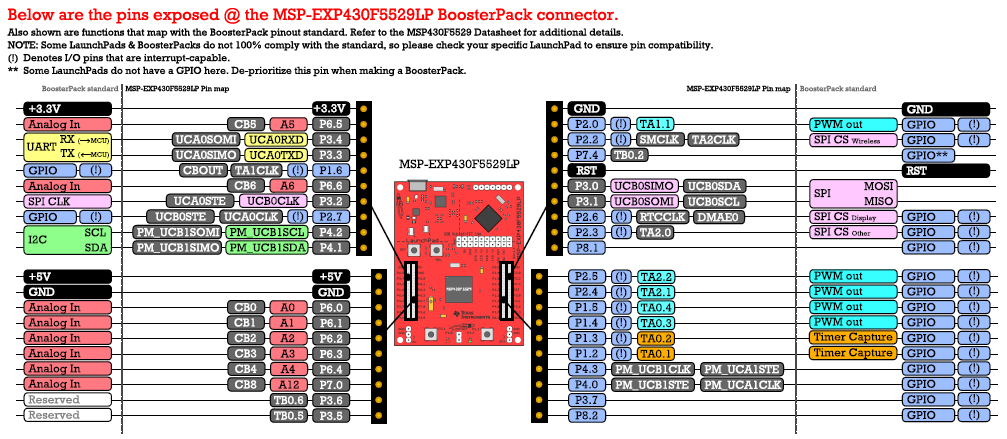
| 16:41, 11 December 2015 | EXP430PinOut.png (file) |  |
121 KB | Frohro | This is the sheet that comes with the MSP-EXP430LP. | 1 |
| 16:46, 28 October 2015 | Logic Analyzer.png (file) |  |
205 KB | Frohro | 1 | |
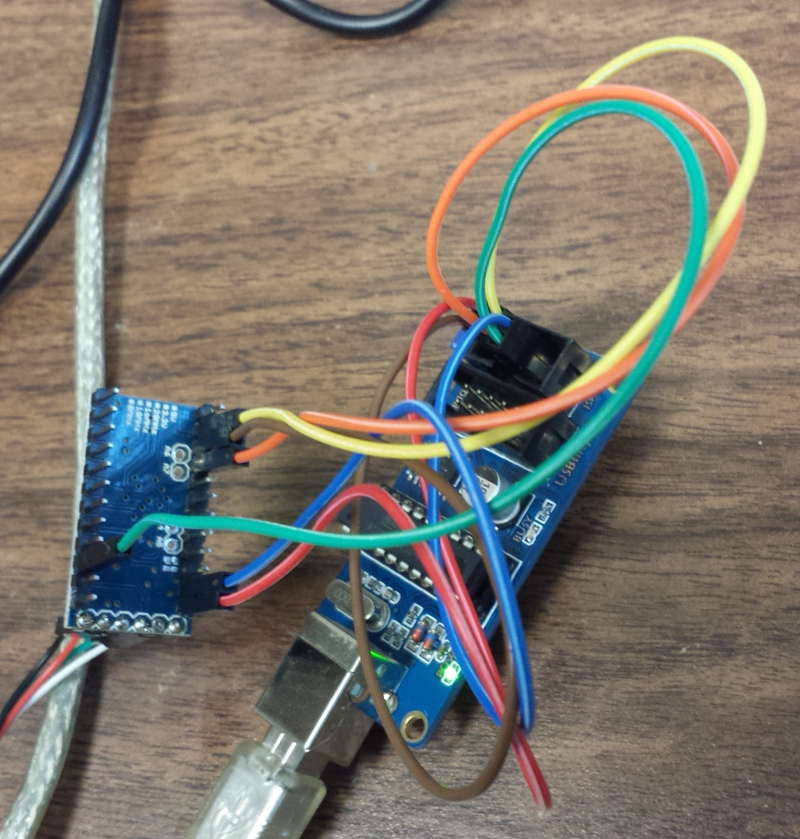
| 16:41, 4 March 2014 | Programmer connections.jpg (file) |  |
385 KB | Frohro | Connections between the USBtinyISP and the Arduino Pro Mini to program the bootloader. | 1 |
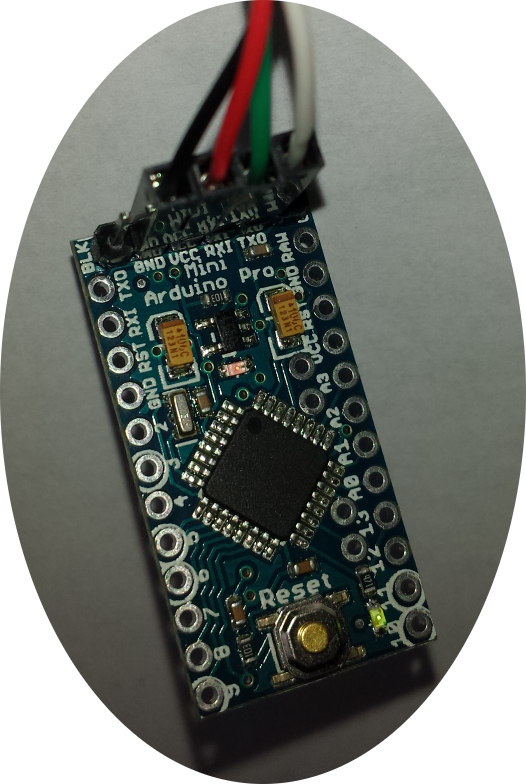
| 13:25, 23 February 2014 | Arduino-serial.jpg (file) |  |
184 KB | Frohro | 1 | |
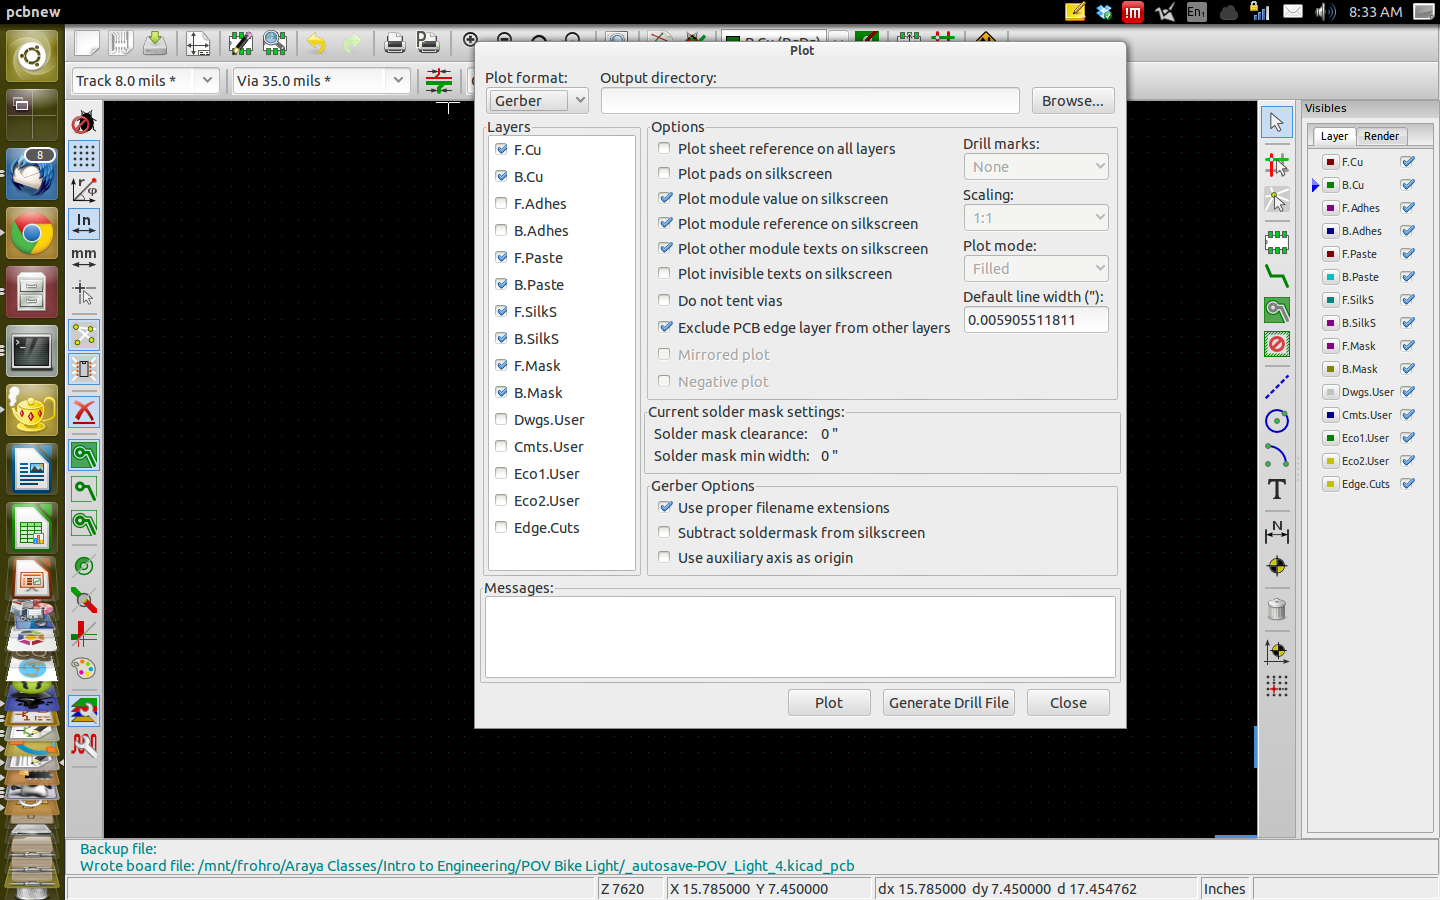
| 09:34, 19 February 2014 | Plot Gerbers.png (file) |  |
270 KB | Frohro | 3 | |
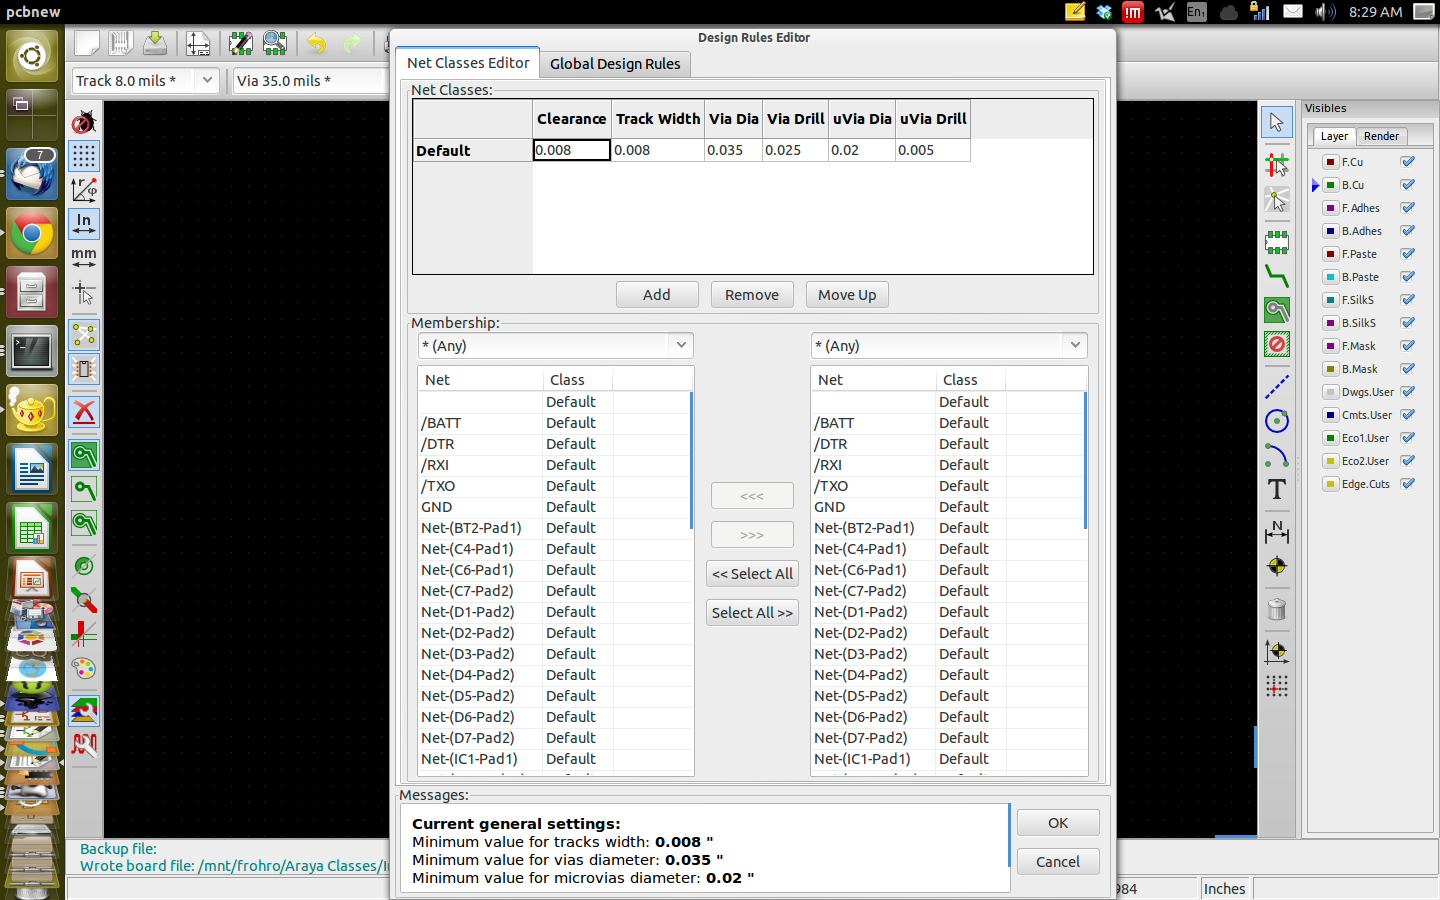
| 09:30, 19 February 2014 | Design Rules.png (file) |  |
261 KB | Frohro | 2 | |
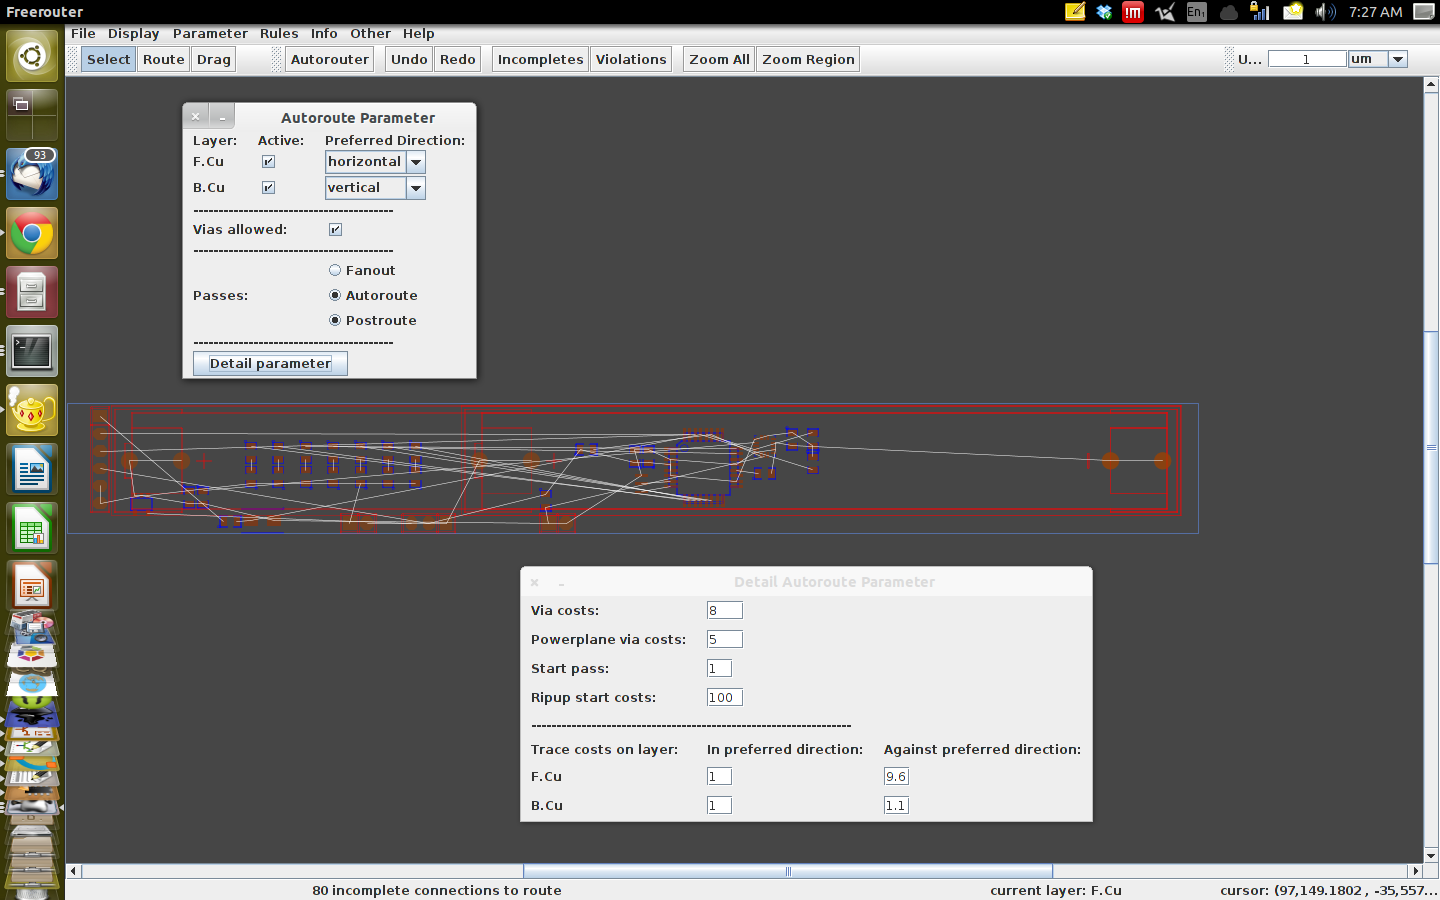
| 08:29, 19 February 2014 | FreeRouter.png (file) |  |
166 KB | Frohro | 1 | |
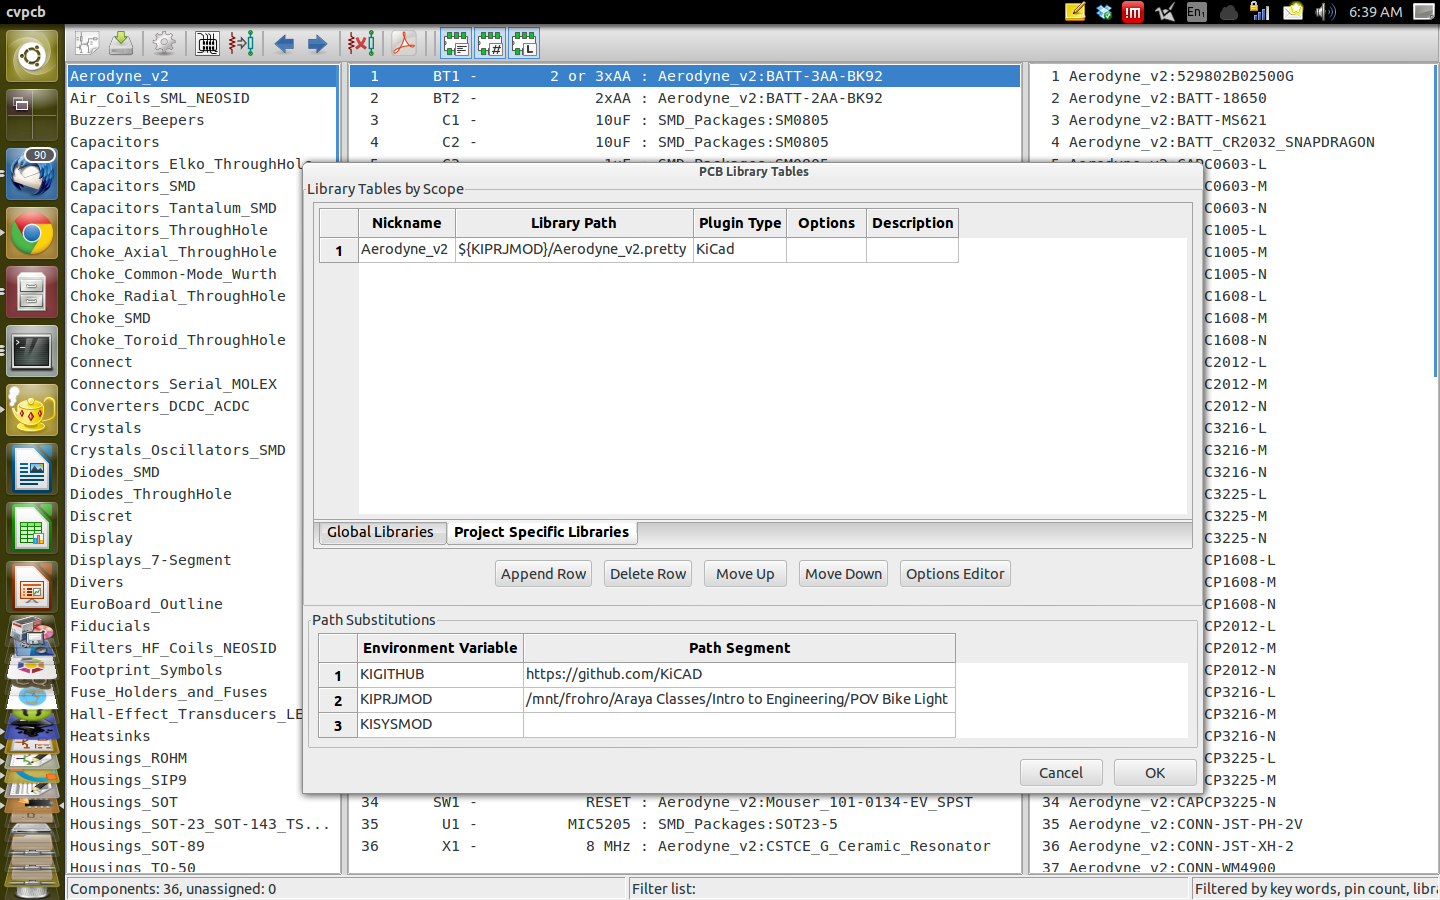
| 07:42, 19 February 2014 | Project Tables.png (file) |  |
296 KB | Frohro | 1 | |
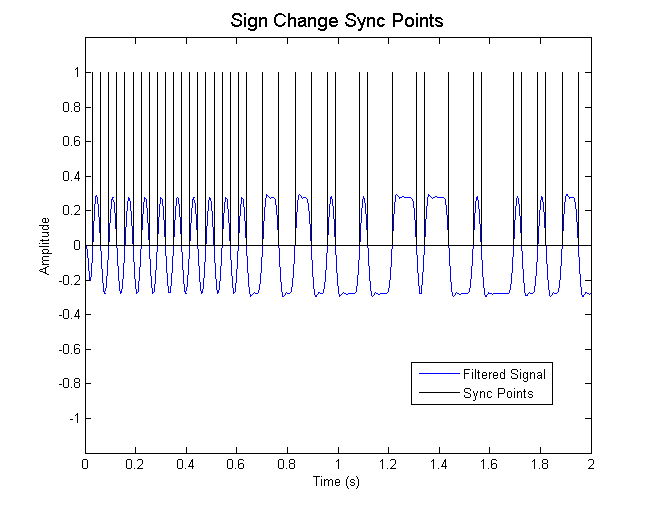
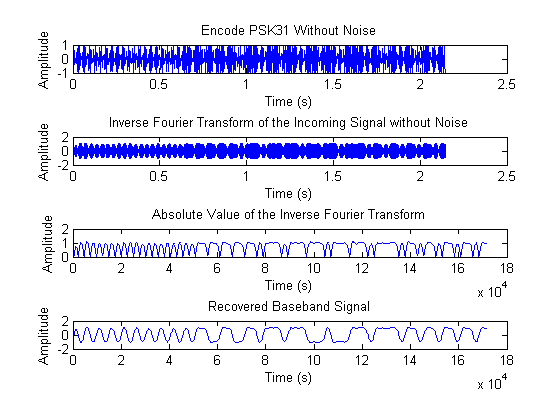
| 21:29, 13 December 2012 | K&M Sync Points.png (file) |  |
6 KB | Michael.vonpohle | 1 | |
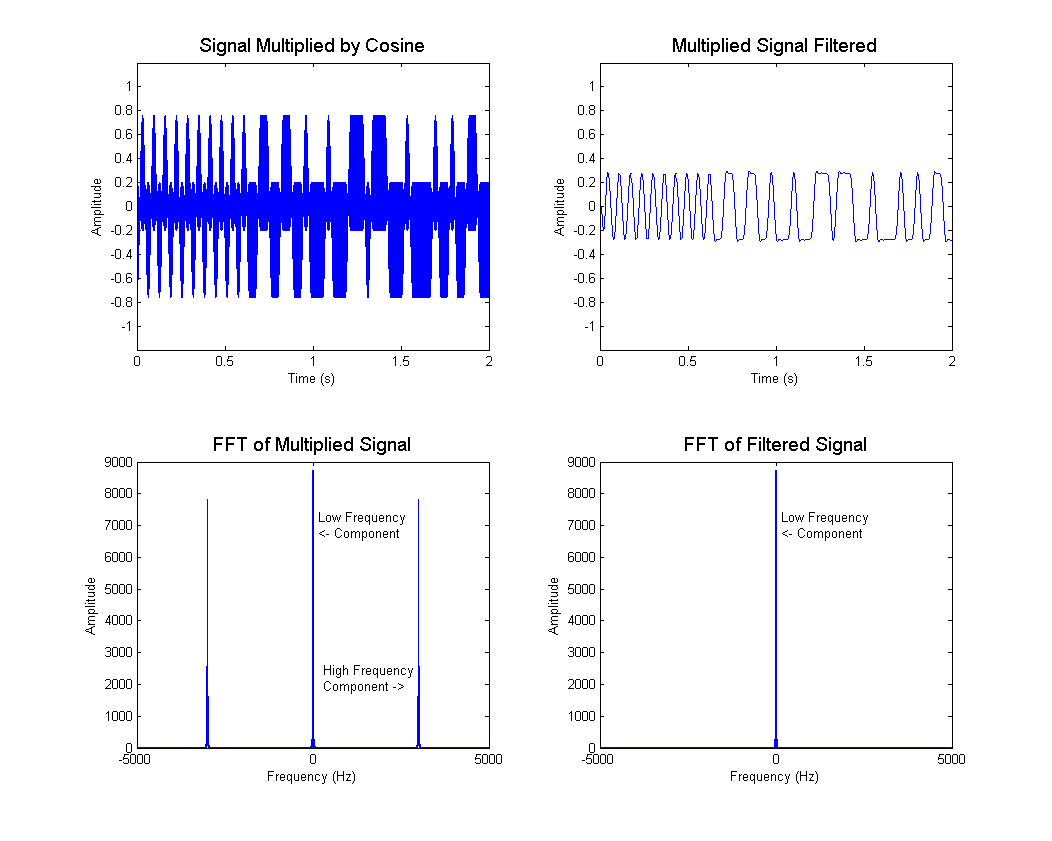
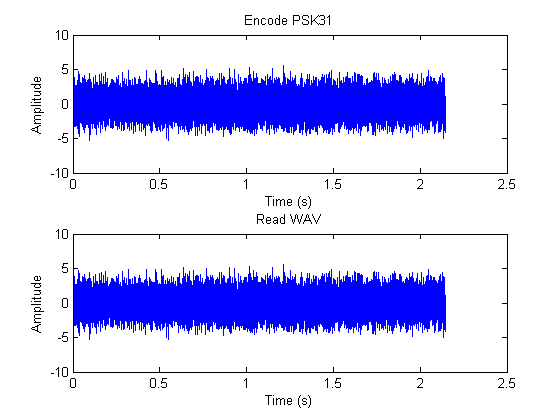
| 21:28, 13 December 2012 | K&M Signal Mixed and Filtered.png (file) |  |
13 KB | Michael.vonpohle | 1 | |
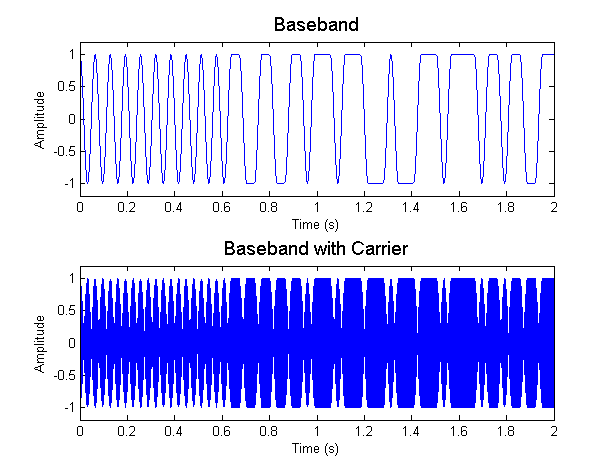
| 21:28, 13 December 2012 | K&M PSK31Signal.png (file) |  |
7 KB | Michael.vonpohle | 1 | |
| 20:17, 12 December 2012 | Figure 3.png (file) |  |
6 KB | Brian.haddad | 1 | |
| 20:17, 12 December 2012 | Figure 2.png (file) |  |
5 KB | Brian.haddad | 1 | |
| 20:16, 12 December 2012 | Figure 1.png (file) |  |
9 KB | Brian.haddad | 1 | |
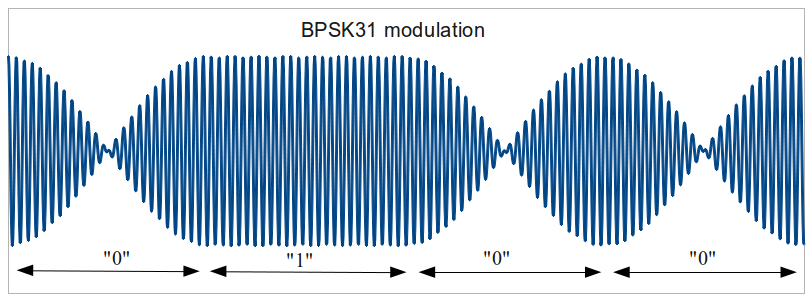
| 23:41, 9 December 2012 | PSK31 sample.png (file) |  |
115 KB | Brian.haddad | 1 | |
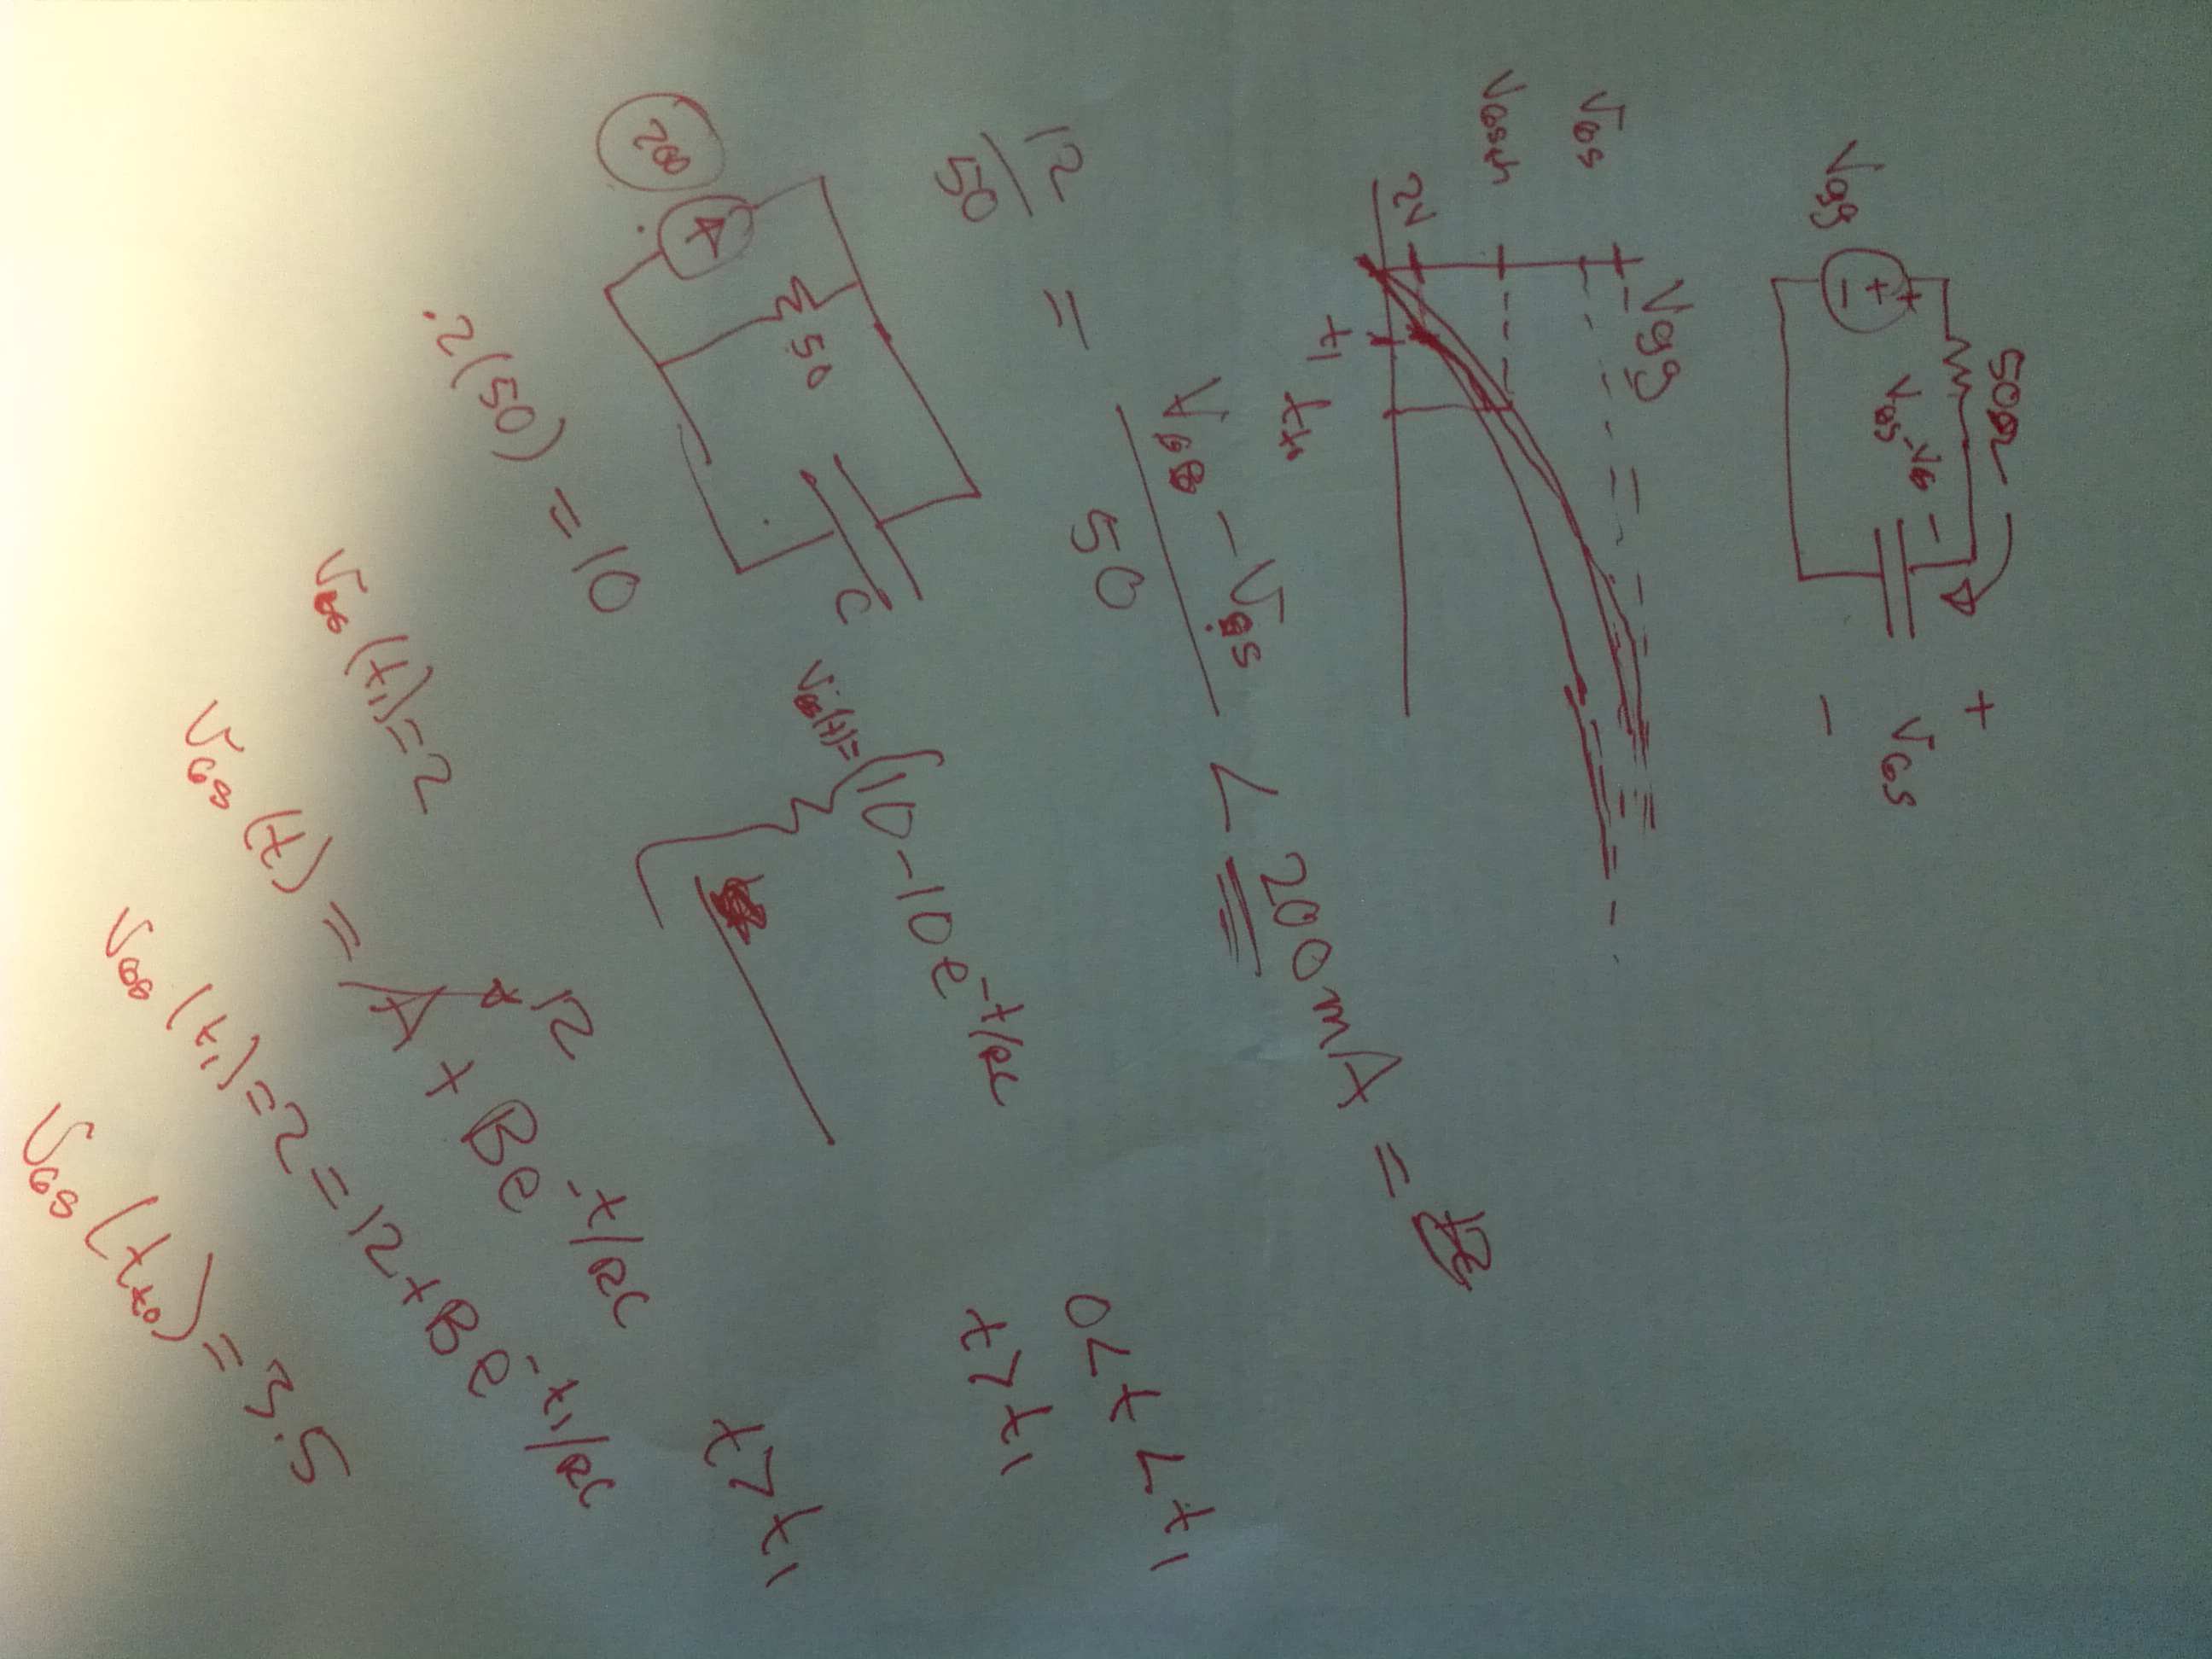
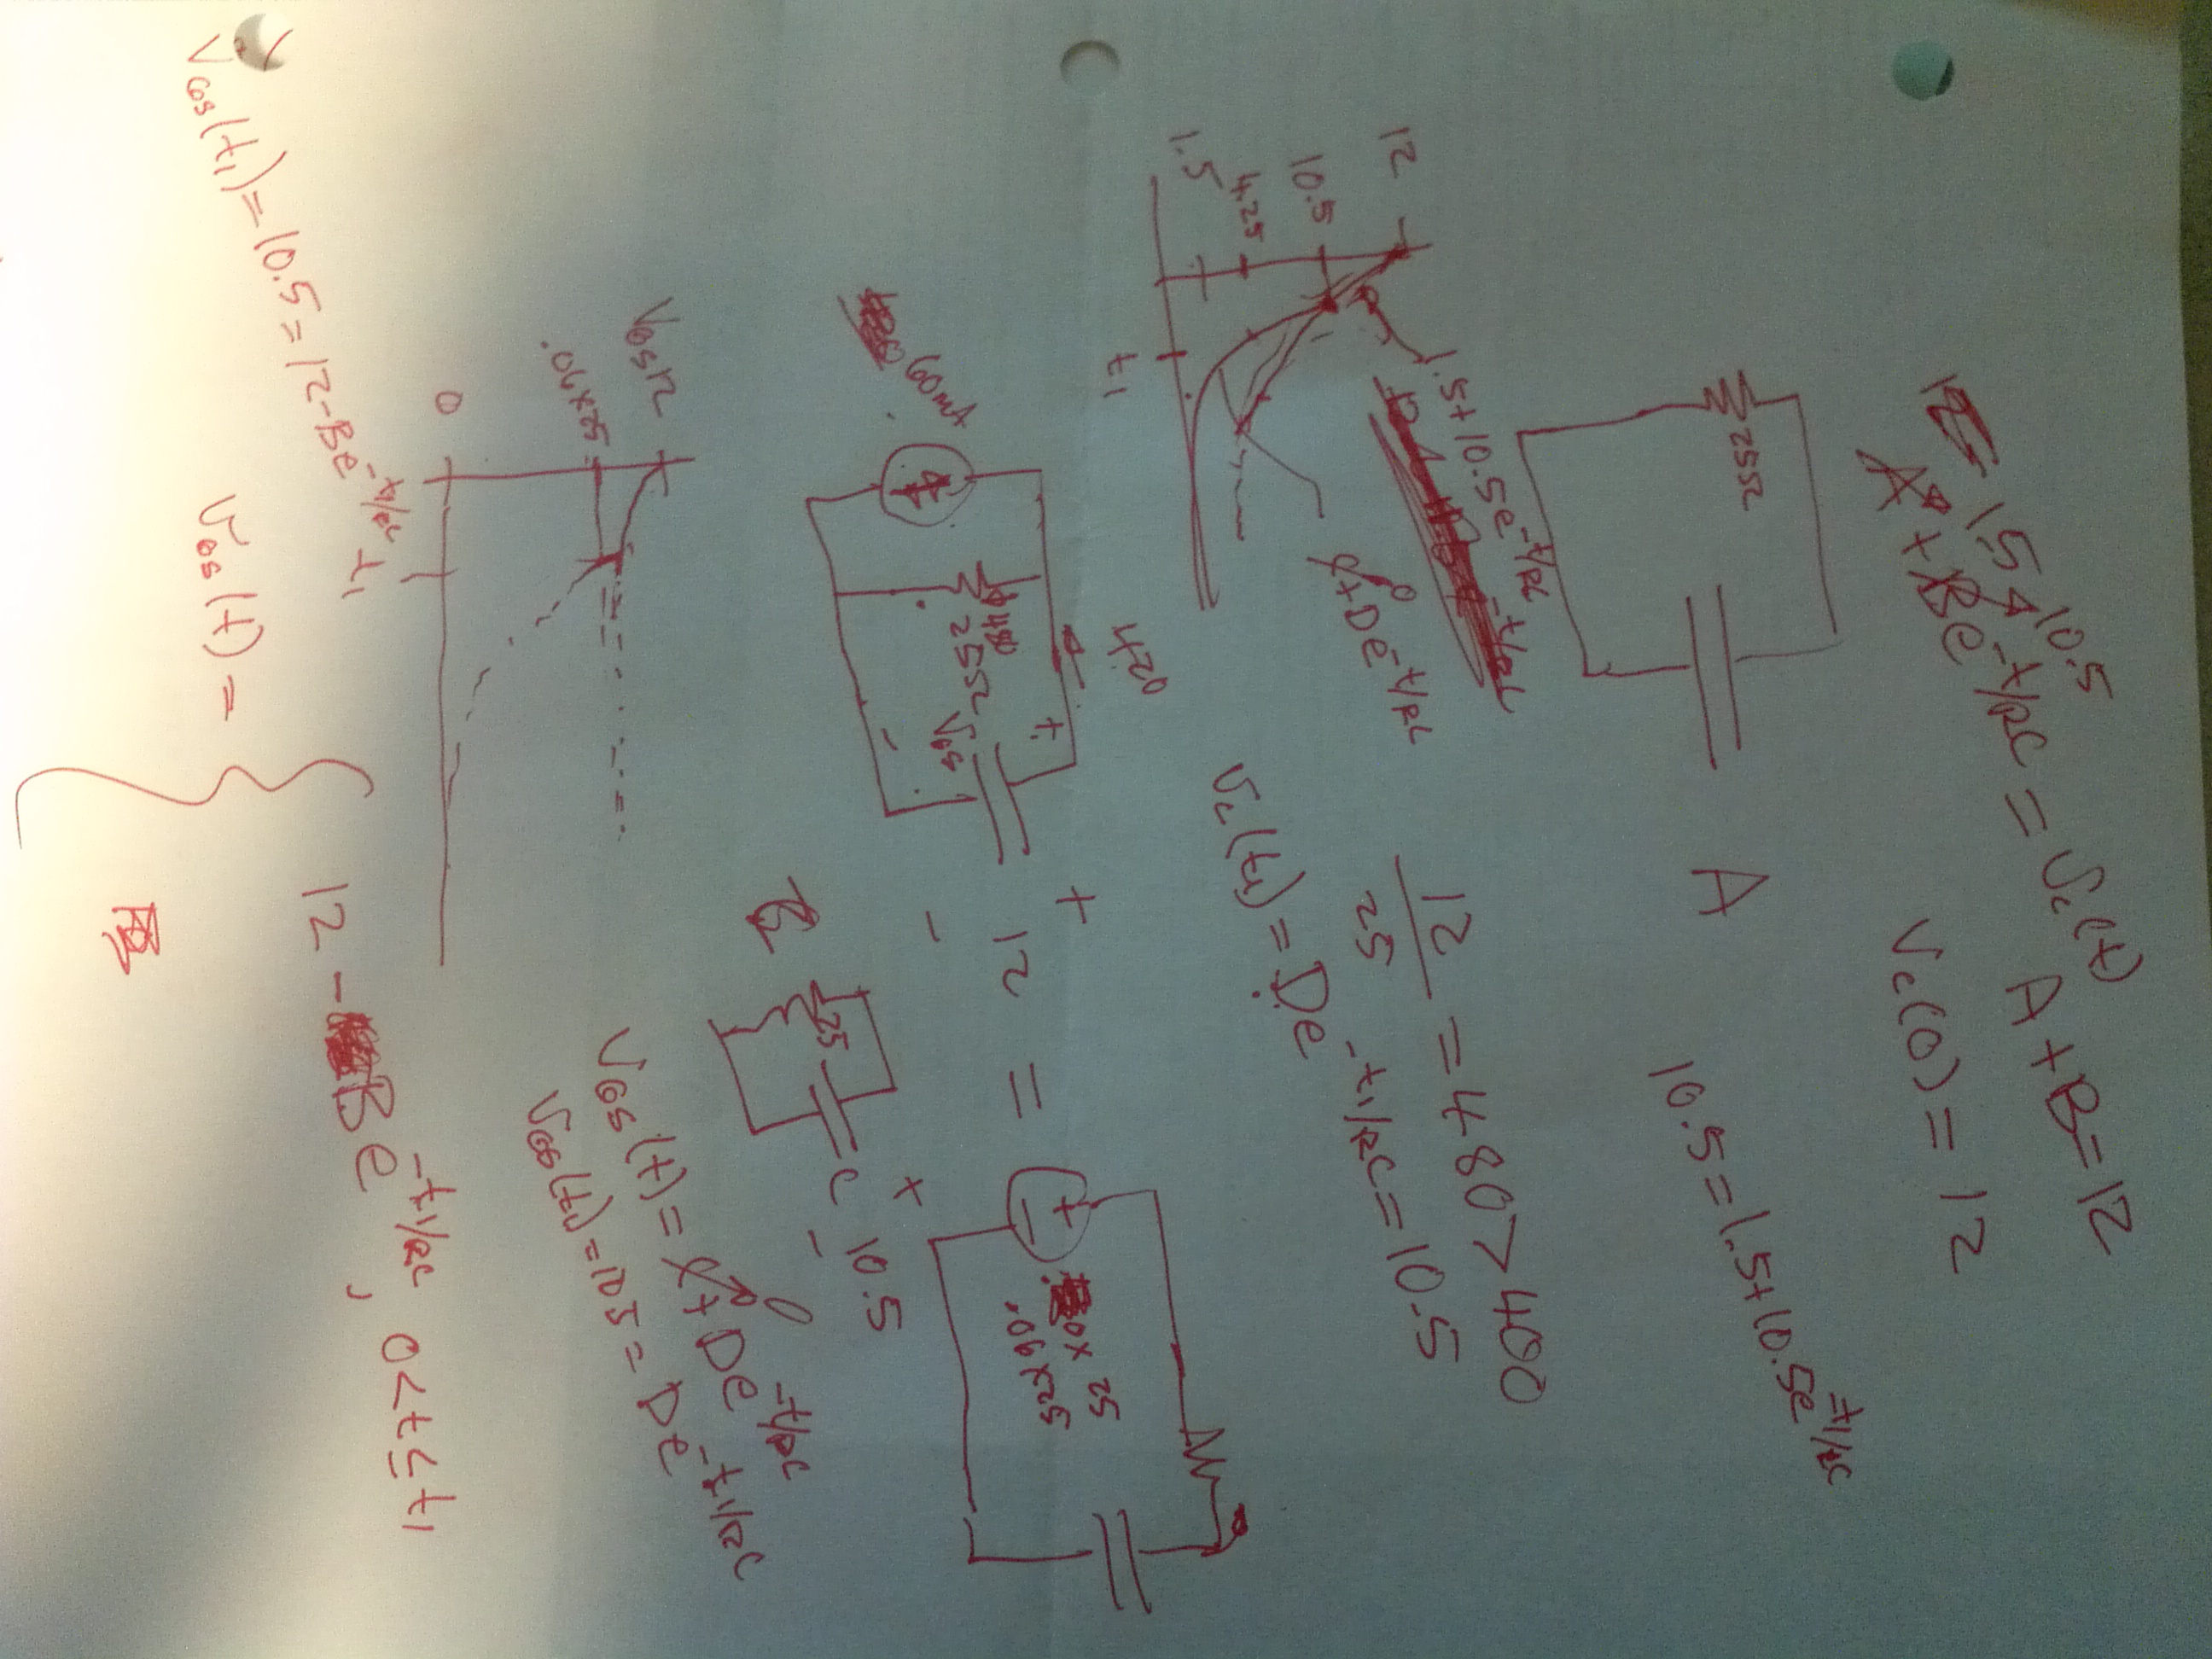
| 21:49, 1 June 2012 | Hw4 5.jpg (file) |  |
944 KB | Btheredude | 1 | |
| 21:49, 1 June 2012 | Hw4 4.jpg (file) |  |
1.06 MB | Btheredude | 1 | |
| 21:49, 1 June 2012 | Hw4 3.jpg (file) |  |
971 KB | Btheredude | 1 | |
| 21:49, 1 June 2012 | Hw4 2.jpg (file) |  |
948 KB | Btheredude | 1 | |
| 21:46, 1 June 2012 | Hw4 1.jpg (file) |  |
1.03 MB | Btheredude | 1 | |
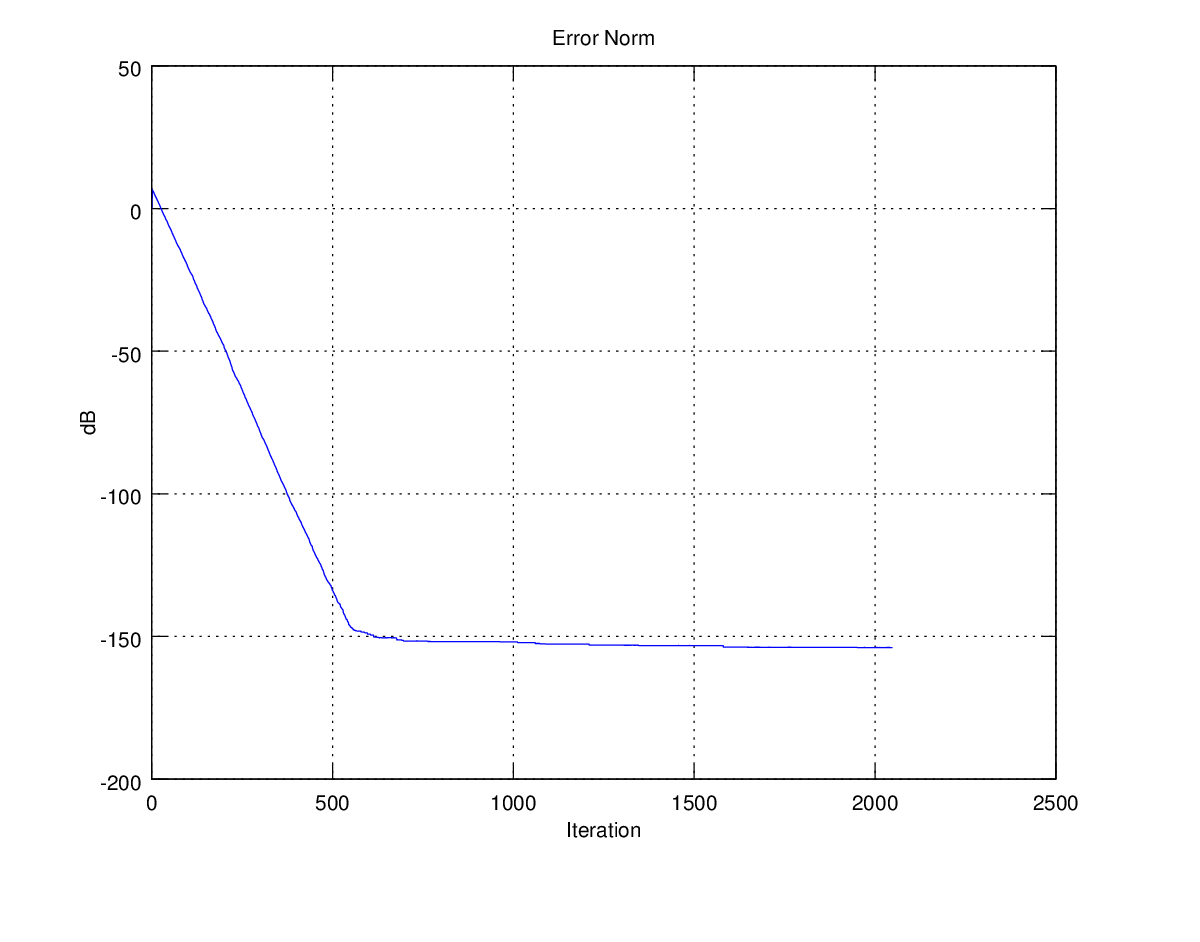
| 21:15, 26 March 2012 | Freq adaptive result.png (file) |  |
27 KB | Frohro | Error for adaptive fft filter.... | 1 |
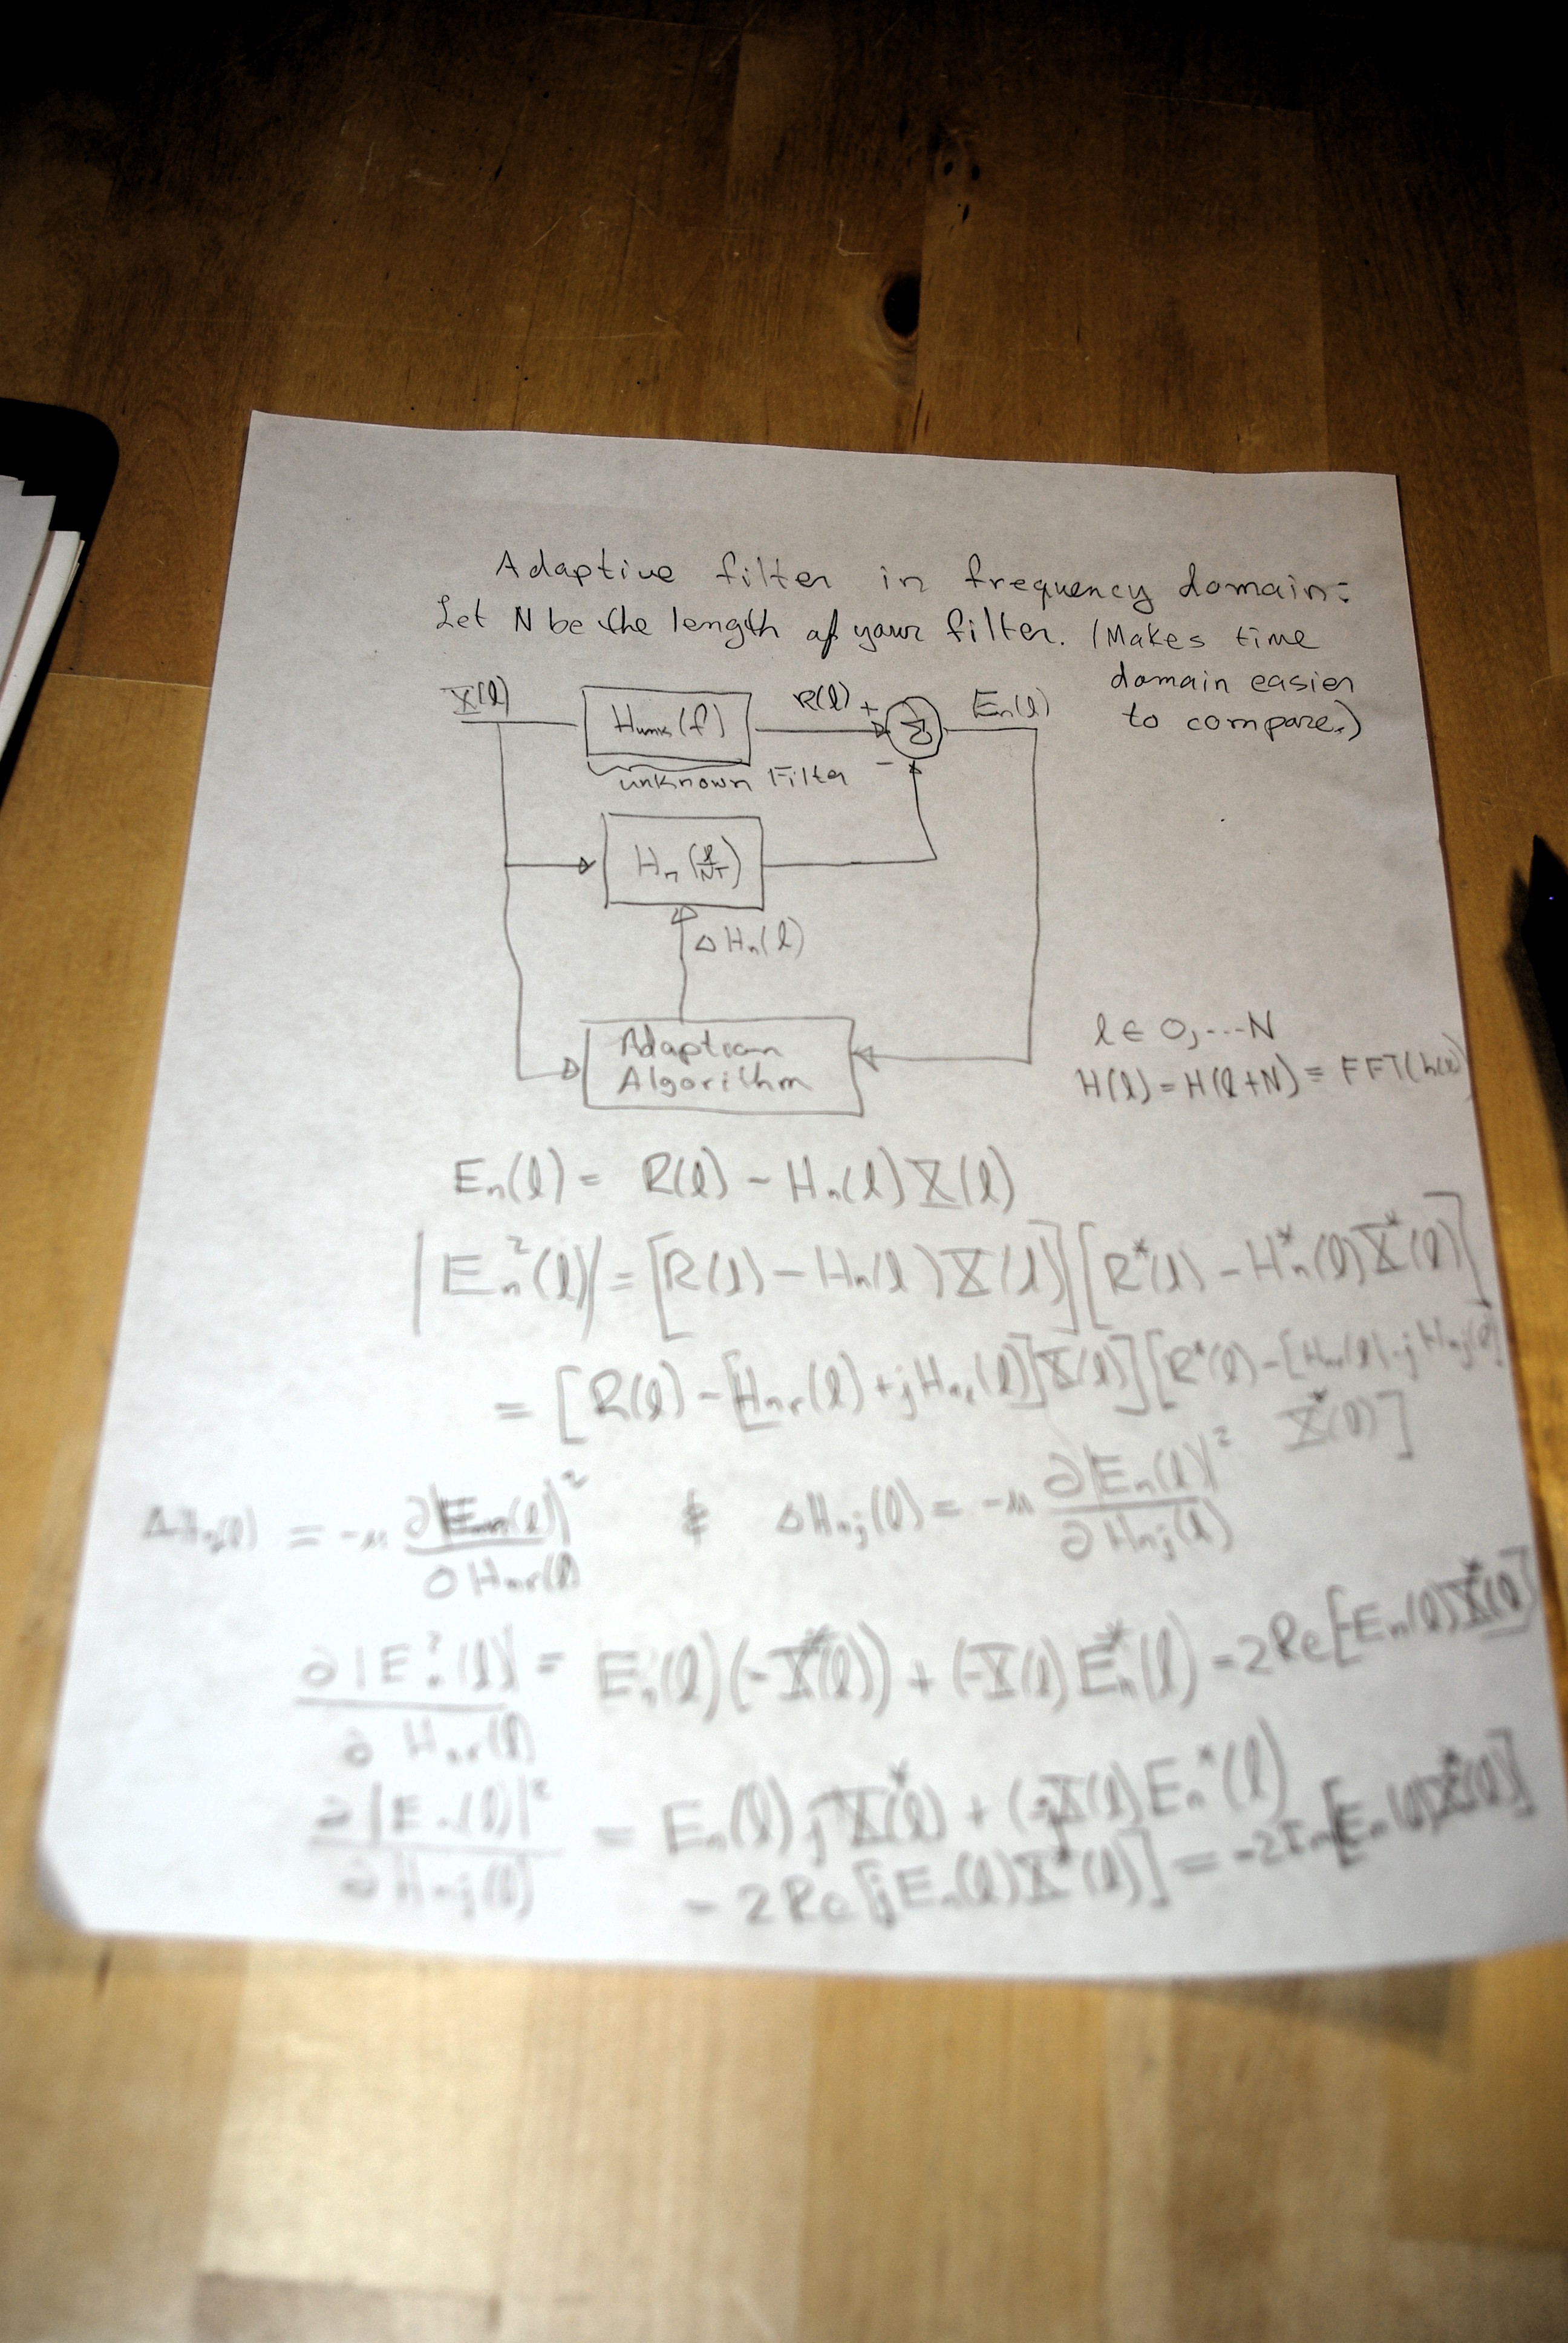
| 20:40, 26 March 2012 | Adaptive Filter Frequency Domain Approach.JPG (file) |  |
1.58 MB | Frohro | This shows how to make an LMS adaptive filter using the frequency domain instead of the time domain. This is useful when making a filter that optimizes something in the time domain, like image rejection for example. | 1 |
| 01:59, 8 June 2011 | Limit on bottom.gif (file) |  |
13 KB | Btheredude | 1 | |
| 01:59, 8 June 2011 | Limit on bottom circ.gif (file) |  |
53 KB | Btheredude | 1 | |
| 01:55, 8 June 2011 | Limit on top graph.gif (file) |  |
12 KB | Btheredude | 1 | |
| 01:53, 8 June 2011 | Limit on top.gif (file) |  |
56 KB | Btheredude | 1 | |
| 01:40, 25 May 2011 | Data in Top.jpg (file) |  |
24 KB | Btheredude | 1 | |
| 01:30, 25 May 2011 | Data in Bottom.JPG (file) |  |
19 KB | Btheredude | 1 | |
| 01:26, 25 May 2011 | Data in bottom.JPG (file) |  |
19 KB | Btheredude | Schematic of data coming in on the top | 1 |
| 00:54, 25 May 2011 | Data in bottom.gif (file) |  |
99 KB | Btheredude | Schematic of data coming in on the top | 1 |
| 11:51, 23 February 2011 | RLC control delay.png (file) |  |
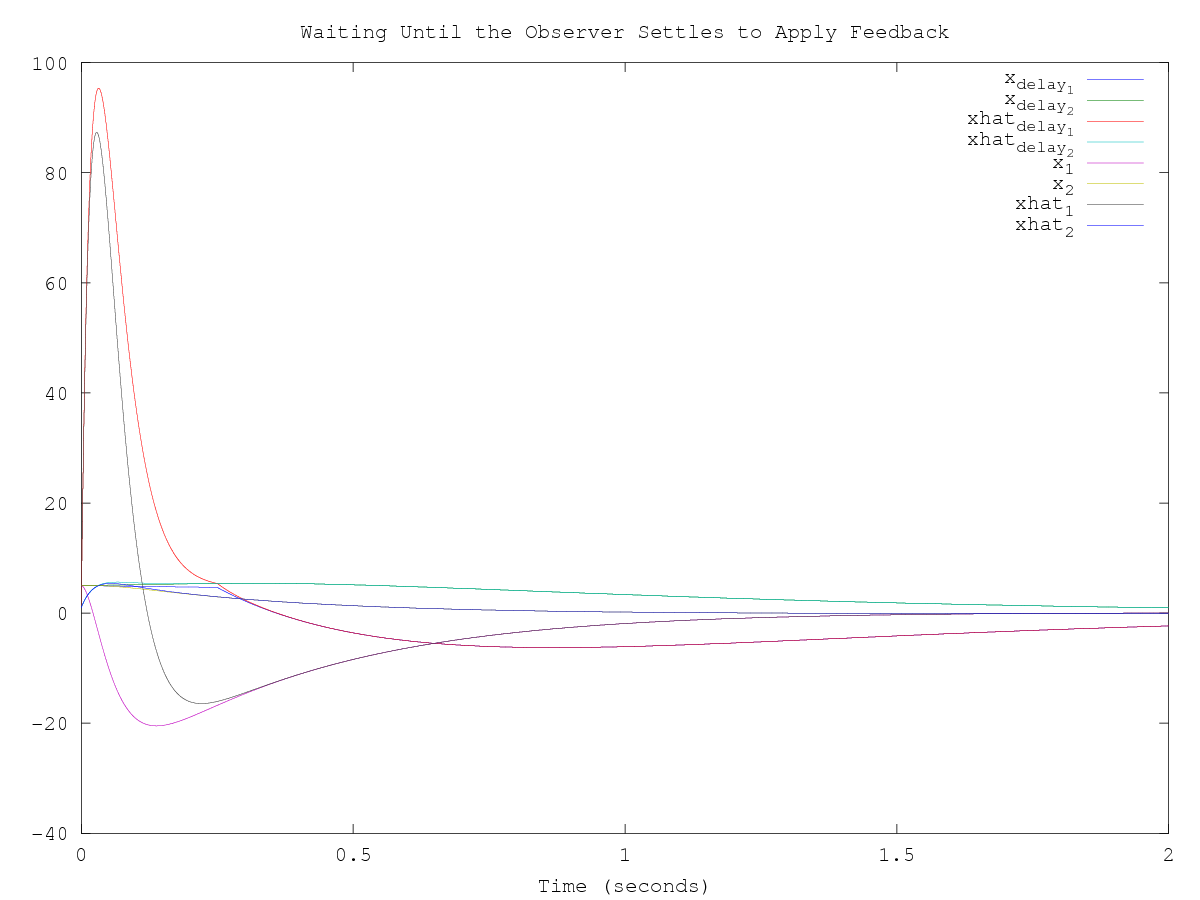
36 KB | Frohro | This figure shows the effect of delaying the control signal until the observer is more accurate. | 1 |
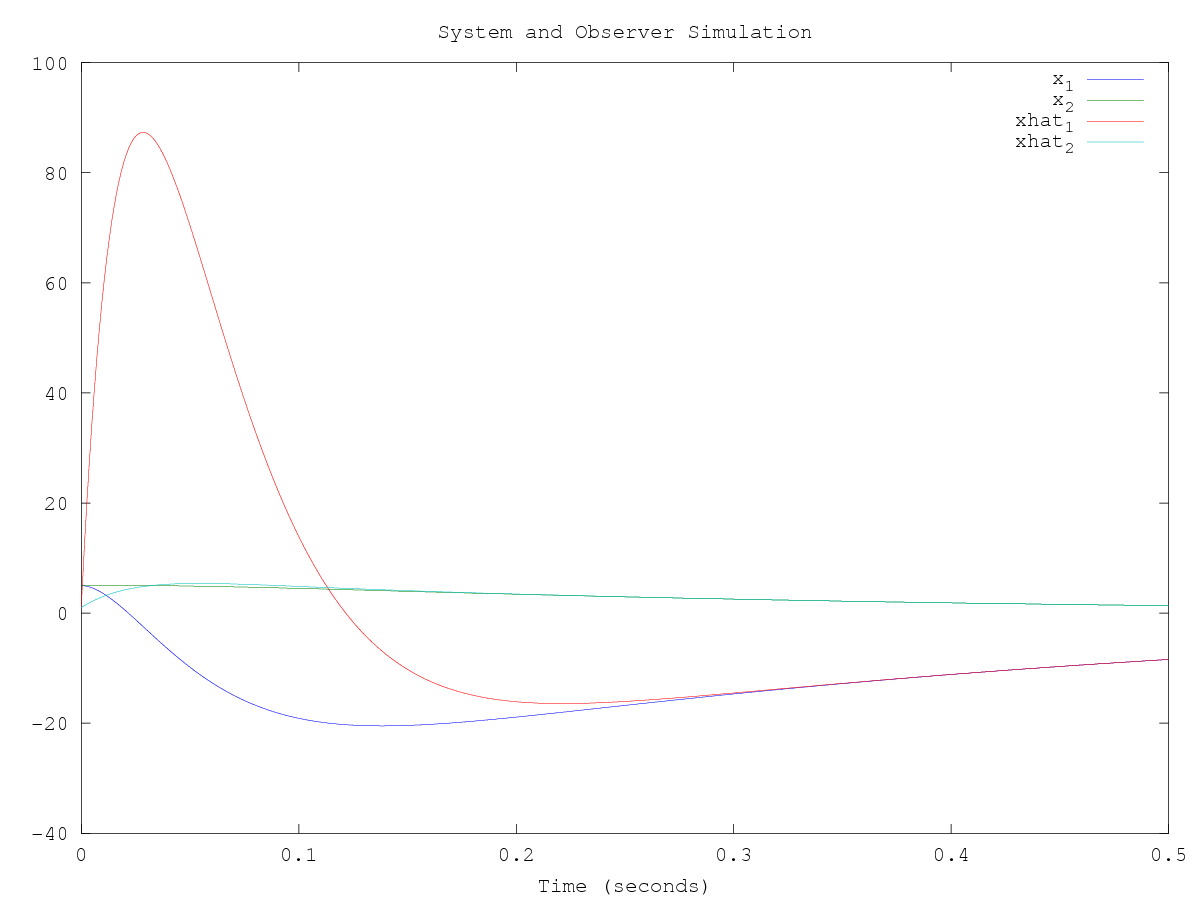
| 11:45, 23 February 2011 | RLC control.png (file) |  |
25 KB | Frohro | This plot shows the state variables and the simulated state variables as a function of time with the initial conditions of the Octave file above. | 1 |
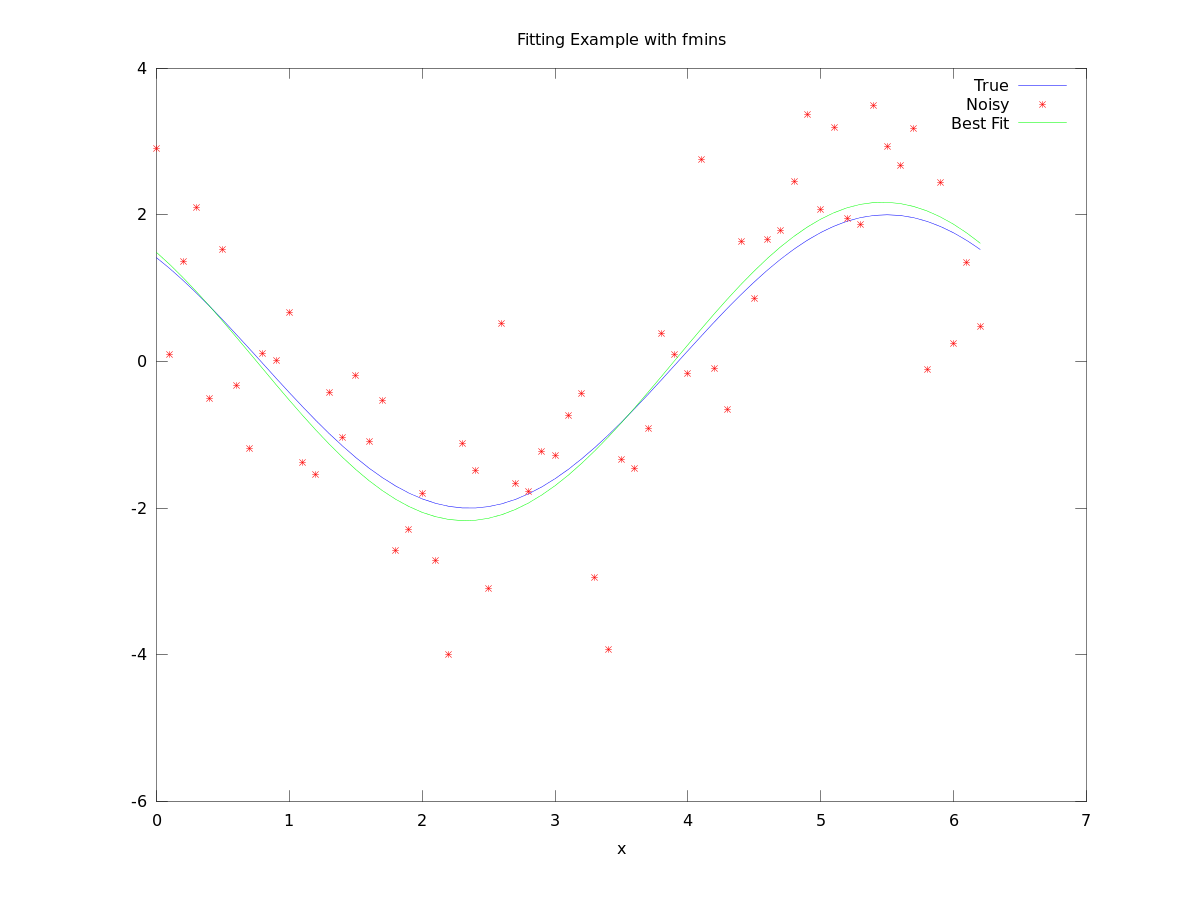
| 18:04, 6 January 2011 | Fit example.png (file) |  |
36 KB | Frohro | This is the plot the example makes. | 1 |