Digital Image Processing
DSP is used extensively in image processing. For example as an in class project, lets remove the dithering patterns of dots in this image of Donald Duck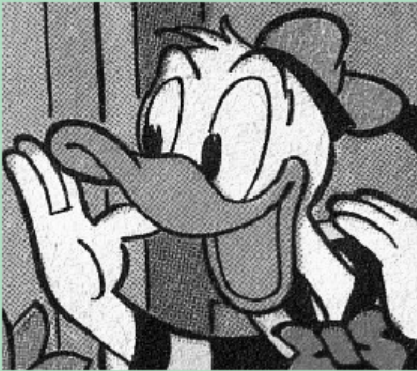 .
.
These dots occur in the printing process used in newspapers in the past as a way to shade the picture without fine pixel or color control. The process was developed in the early nineteenth century by Ben Day, and is called the [Ben Day process].(https://en.wikipedia.org/wiki/Ben_Day_process)
- Read in the image, find its shape, and display it.
In [4]:
import numpy as np
import matplotlib.pyplot as plt
import matplotlib

im = plt.imread("Donald_Duck.png")
im.shape
print(im.shape)

def plti(im, h=8, **kwargs):
    """
    Helper function to plot an image.
    """
    y = im.shape[0]
    x = im.shape[1]
    w = (y/x) * h
    plt.figure(figsize=(w,h))
    plt.imshow(im, interpolation="none", **kwargs)
    plt.axis('off')
    plt.show()

plti(im)

- A little green is visible around the outside of the image, so lets crop the image to remove it.
In [5]:
im1 = im[10:im.shape[0]-10, 10:im.shape[1]-10]
- Now convert the RGB image to grayscale. The three in the size above are the red, green, and blue components. The formula to convert is $$ L_{gray} = 0.2989R + 0.587G+0.114B$$ where $L_{gray}$ is the grayscale luminosity, $R$ is the red intensity, $G$ is the green intensity, and $B$ is the blue intensity. This formula was specified by the National Television System Committee (NTSC).
In [6]:
def rgb2gray(rgb):
    return np.dot(rgb[...,:3], [0.2989, 0.5870, 0.1140])
gray_im = rgb2gray(im1)
plt.gray()  # Means all further plots will be gray scale.
plti(gray_im)

- You figure out how to remove the dithering. A good set of slides on image processing using the methods of our class is here.
In [ ]:
In [ ]:
Hint: See this web page if you have no ideas, but first please think about it and look at the image closely to see if you can figure it out yourself.