ASN10 - Frequency response of low pass filters: Difference between revisions
Jodi.Hodge (talk | contribs) |
Jodi.Hodge (talk | contribs) |
||
| Line 8: | Line 8: | ||
== Response == |
== Response == |
||
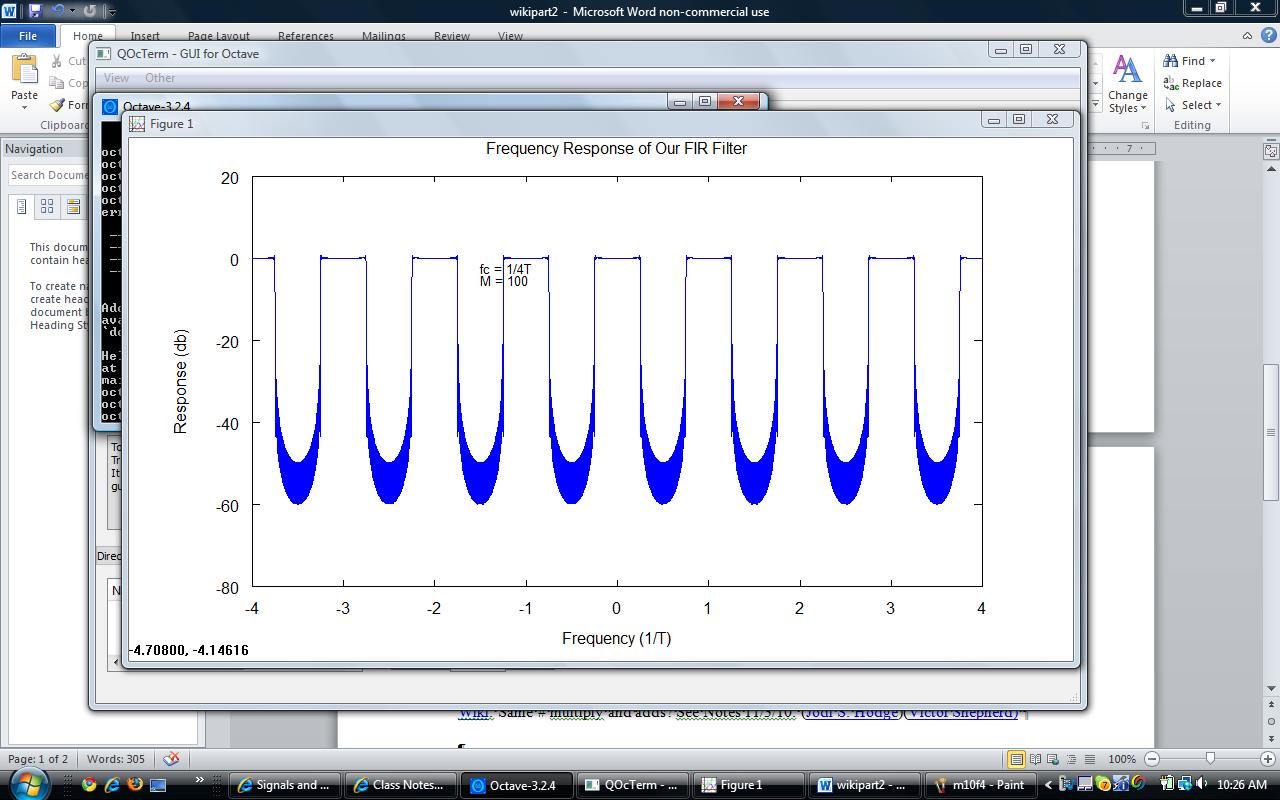
First image of frequency response cutoff frequency 1/4T with 100 filter coefficients. |
|||
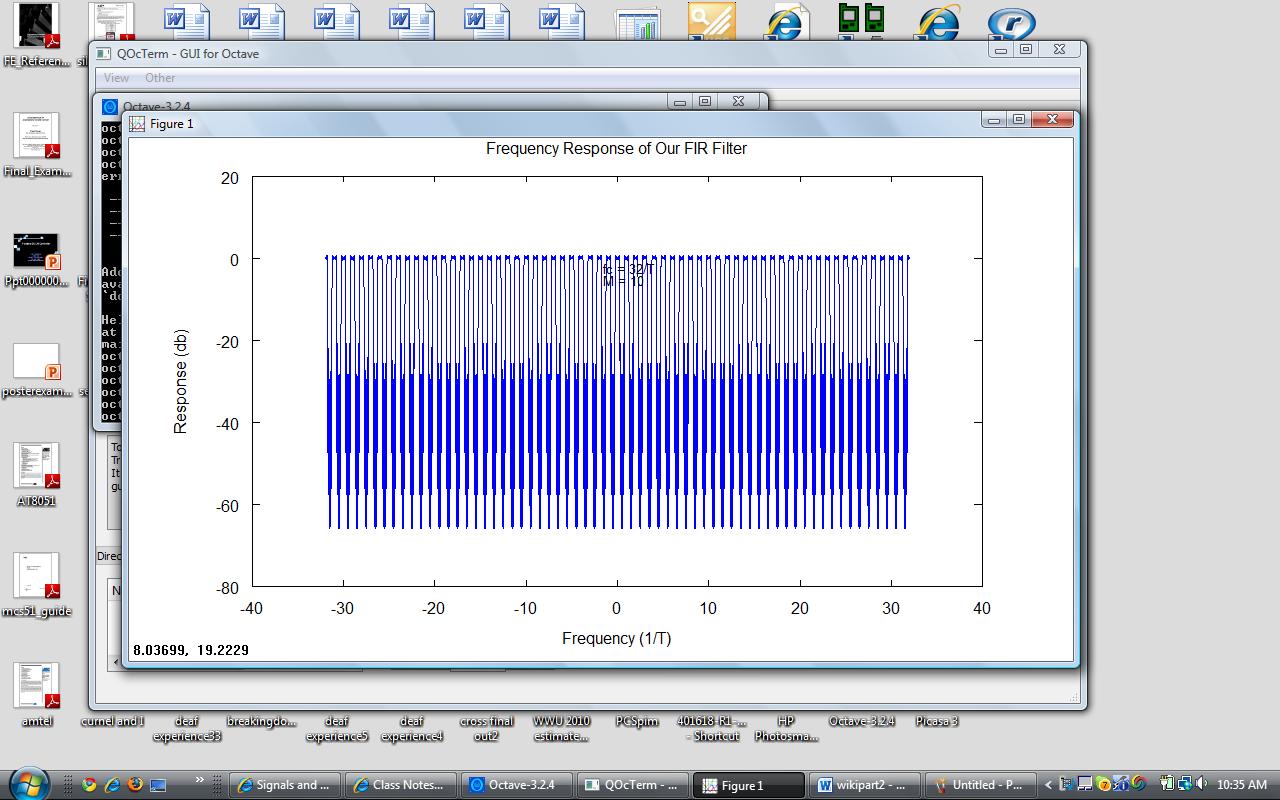
In octave I creating various plots varying cutoff frequency 1/4T, 1/8T, 1/32T, and number of filter coefficients 10 and 100. Analyzing the plots, my answer to the question is that it is better to decimate then apply the filter. Below I have posted two images to support my answer. The first image of frequency response cutoff frequency 1/4T with 100 filter coefficients. The second image of frequency response cutoff frequency 1/32T with 10 filter coefficients. |
|||
Second image of frequency response cutoff frequency 1/32T with 10 filter coefficients. |
|||
[[File:M100f4.jpg]] |
[[File:M100f4.jpg]] |
||
Revision as of 11:12, 29 November 2010
Problem Statement
Use Octave (or Mathlab or Silab) to plot the frequency response of low pass filters with cut off frequencies of 1/32T, 1/8T, and 1/4T and compare how many coeffficients are needed with an eye to answer the question “Is it less calculation to decimate and then filter, or better to put the filter in the pre-decimation filter?”
Response
In octave I creating various plots varying cutoff frequency 1/4T, 1/8T, 1/32T, and number of filter coefficients 10 and 100. Analyzing the plots, my answer to the question is that it is better to decimate then apply the filter. Below I have posted two images to support my answer. The first image of frequency response cutoff frequency 1/4T with 100 filter coefficients. The second image of frequency response cutoff frequency 1/32T with 10 filter coefficients.

