Chris' Page on Aliasing using MatLab
Demo of Aliasing Using Matlab
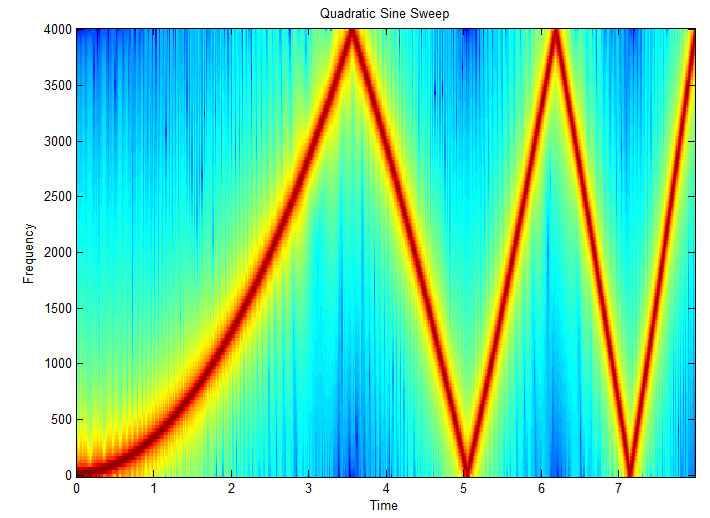
Frequencies above half the sample rate will produce aliasing. This should appear as a lower frequency signal.
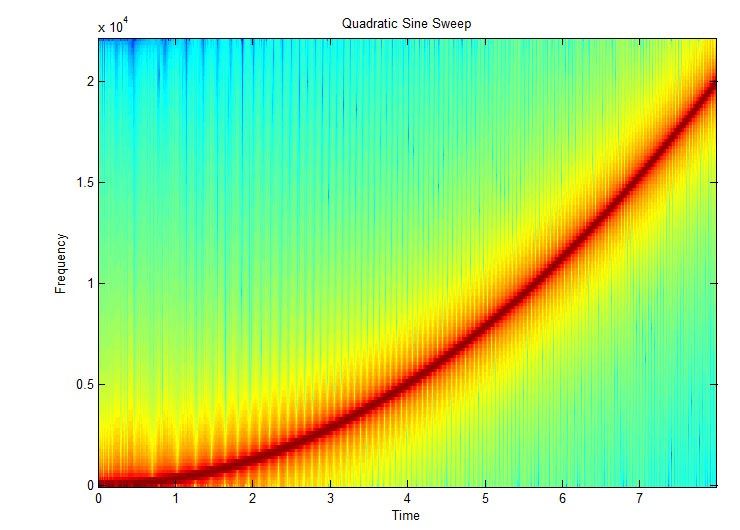
Below is a spectrogram of a quadratic sweep from 20 Hertz to 20,000 Hertz using a 441000 Hertz sample rate.
This one is the same script and parameters except the sample rate has been changed to 8000 Hertz.
Matlab Program
% Chris Rasmussen
% Show aliasing
clc
%****************%
% Parameters
duration = 8
fmax = 20000
fmin = 20
samplerate = 8000
%****************%
%****************%
% Setup Soundcard
% Will still work if this is removed, you just won't hear anything
% It works with my onboard soundcard with Vista.
AO = analogoutput('winsound');
chan = addchannel(AO,1);
set(AO,'SampleRate',samplerate);
set(AO,'TriggerType','Manual');
ActualRate = get(AO,'SampleRate')
%****************%
%****************%
% Setup arrays
totalsamples = ActualRate*duration;
t = 0:1./ActualRate:duration;
y= 0.2 .* chirp(t,fmin,duration, fmax,'q',[],'concave');
%****************%
%****************%
% Write data to soundcard and play
% Will still work if this is removed, you just won't hear anything
putdata(AO,y')
start(AO)
trigger(AO)
waittilstop(AO,duration+1)
%****************%
%****************%
% Plot raw data
figure(1)
plot(y)
title('Waveform')
%****************%
%****************%
% Plot spectragram (uses FFT)
figure(3), specgram(y, 256, samplerate);
title('Quadratic Sine Sweep')
set(gcf,'Color',[1 1 1]);
%****************%
wavwrite(y,samplerate,16,'File.wav')
%****************%
% Picking up the messes
delete(AO)
clear AO
clear all

