File:RLC control.png
Jump to navigation
Jump to search
Size of this preview: 800 × 600 pixels. Other resolution: 1,200 × 900 pixels.
Original file (1,200 × 900 pixels, file size: 25 KB, MIME type: image/png)
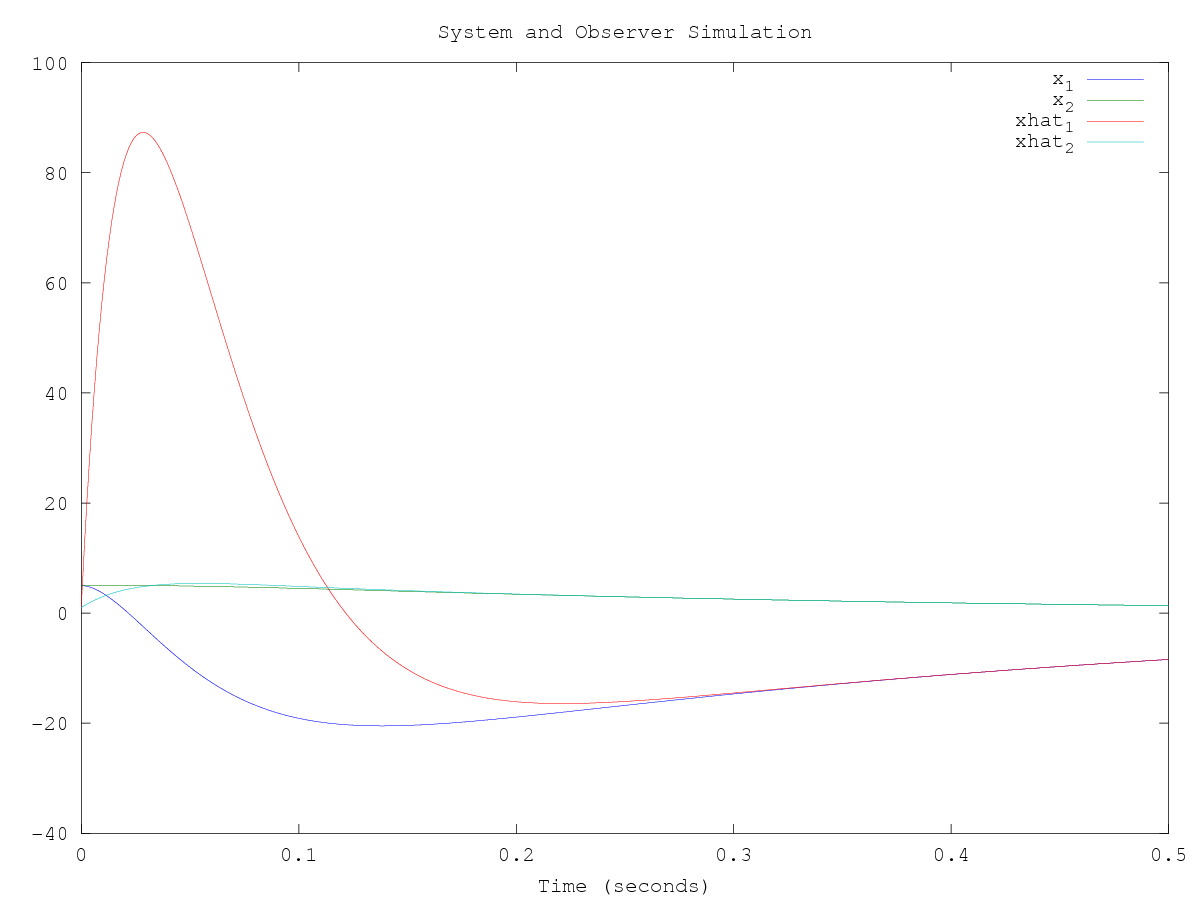
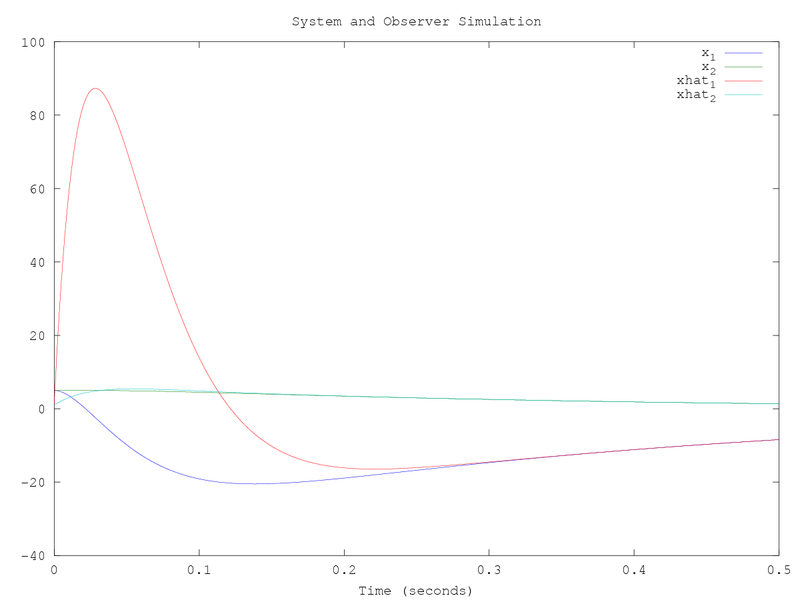
This plot shows the state variables and the simulated state variables as a function of time with the initial conditions of the Octave file above.
File history
Click on a date/time to view the file as it appeared at that time.
| Date/Time | Thumbnail | Dimensions | User | Comment | |
|---|---|---|---|---|---|
| current | 11:45, 23 February 2011 | | 1,200 × 900 (25 KB) | Frohro (talk | contribs) | This plot shows the state variables and the simulated state variables as a function of time with the initial conditions of the Octave file above. |
File usage
The following page uses this file: