HW10: Difference between revisions
No edit summary |
No edit summary |
||
| Line 6: | Line 6: | ||
I decided to show a cross correlation example using MATLAB. |
I decided to show a cross correlation example using MATLAB. |
||
About cross correlation: |
|||
First of all correlation is defined as<br> |
|||
[[image:Img1204.png]] |
|||
We may interpret the correlation operator as |
|||
which is <math>||x||^2=N </math> times the coefficient of projection onto x of y advanced by n samples (shifted circularly to the left by n samples). The time shift n is called the correlation lag, and the function is called a lagged product. |
|||
This is then used to define cross correlation as |
|||
[[image:Img1541.png]] |
|||
The term ``cross-correlation'' comes from statistics, and what is defined here is more properly called a ``sample cross-correlation.'' |
|||
This definition of a sample cross-correlation is only valid for stationary stochastic processes, e.g., ``steady noises'' that sound unchanged over time. The statistics of a stationary stochastic process are by definition time invariant, thereby allowing time-averages to be used for estimating statistics such as cross-correlations. For brevity below, we will typically not include ``sample'' qualifier, because all computational methods discussed will be sample-based methods intended for use on stationary data segments. |
|||
The DFT of the cross-correlation may be called the cross-spectral density, or ``cross-power spectrum,'' or even simply ``cross-spectrum'': <br> |
|||
[[image:Img15544.png]] |
|||
Revision as of 23:29, 2 December 2009
Problem Statement
Present an Octave (or MATLAB) example using the discrete Fourier transform (DFT).
Solution
I decided to show a cross correlation example using MATLAB.
About cross correlation:
First of all correlation is defined as
 We may interpret the correlation operator as
which is times the coefficient of projection onto x of y advanced by n samples (shifted circularly to the left by n samples). The time shift n is called the correlation lag, and the function is called a lagged product.
This is then used to define cross correlation as

The term ``cross-correlation comes from statistics, and what is defined here is more properly called a ``sample cross-correlation.
This definition of a sample cross-correlation is only valid for stationary stochastic processes, e.g., ``steady noises that sound unchanged over time. The statistics of a stationary stochastic process are by definition time invariant, thereby allowing time-averages to be used for estimating statistics such as cross-correlations. For brevity below, we will typically not include ``sample qualifier, because all computational methods discussed will be sample-based methods intended for use on stationary data segments.
The DFT of the cross-correlation may be called the cross-spectral density, or ``cross-power spectrum, or even simply ``cross-spectrum:
File:Img15544.png
close all
clear all
f = 2; % sine wave frequency
tmax = 2; % go to 2 seconds
theta = pi/4;
T = 0.01;
t = 0:T:tmax;
N = length(t);
Nmat = 0:N-2;
Zmat = Nmat *0;
sig1 = sin(2*pi*f*t); % A alpha signal
sig2 = sin(2*pi*f*t); % A beta signal
c= conv(sig1,sig2); %test of matrix size
%zeropad both vectors to length N1+N2-1 to avoid cyclic convolution
sigA = fft([sig1 Zmat]);
sigB = fft([sig2 Zmat]);
sigC = real(ifft(sigA.*sigB));
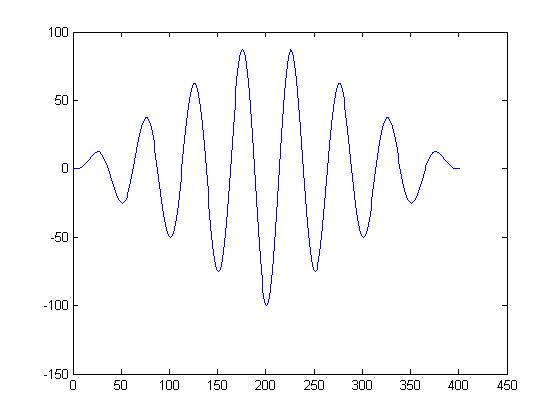
cross correlatoin of same wave

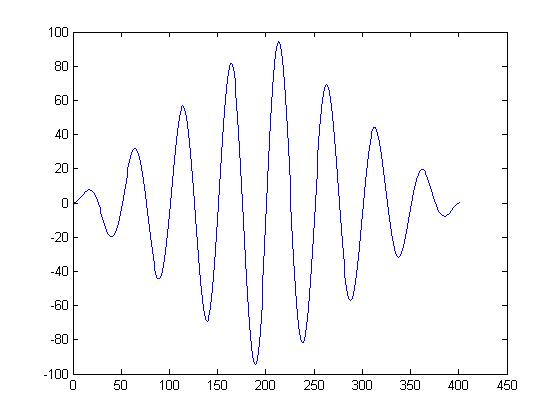
cross correlation with 90degree delay

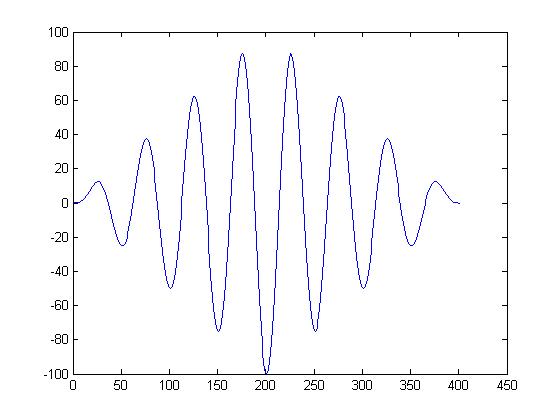
cross correlation with 45 degree delay
[[image:45shift.jpb


