Ben Henry LNA Homework
HW#5
The below problem, although simple, is done with variables so values can be plugged in afterwords. Thus, one can see how the problem progresses and see where the initial conditions end up at the end.
PROBLEM STATEMENT:
Solve for current i(t) in CIRCUIT A below using Laplace Transforms.  , Failed to parse (syntax error): {\displaystyle r=40Ω}
,
, Failed to parse (syntax error): {\displaystyle r=40Ω}
,  ,
, 
The two circuits (A and B below) are the same circuit. B is the same as A, only it shows are current when we use KVL and after we have moved the circuit into the "S" domain.
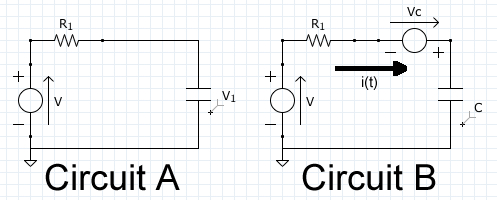
Write Each Components in Laplace Form
Go from the "t" to the "s" domain right off the bat. Using KVL and assuming the current from ground through the voltage source>resister>capacitor>back to ground.
Voltage Source in Volts:  -> -
-> -
 (0)/S
(0)/S
Resister in OHMs: r -> R
Capacitor in Farads: c -> 1/(CS) -  (0) Where is the initial voltage of the cap.
Apply KVL to Circuit B in S Domain
- +I(s)(R+
 )-(0)=0
Solving for I(S)

Performing the inverse Laplace

Apply Initial Conditions
Failed to parse (syntax error): {\displaystyle r = 40 Ω}


HW#6 "Initial and Final Value Theorems"
Initial Value Theorem

Applying to our equation for i(t) we have
IVT of i(t)=
Final Value Theorem

Applying to our equation for i(t) we have
FVT of i(t)=
With this result of zero "0" we know that eventually the current will go to zero. After examining the circuit, it is quite obvious that the current will go to zero once the capacitor is charged.
If the voltage v(t) is desired instead
If in either the IVT or FVT you want to find v(t) instead of i(t), simply multiply the current i(t) by the resistance R. e.g. 
HW#7 "Bode Plots" with a TI-89
To graph H(s) as a Bode Plot on a TI-89, it is a simple 1,2,3,4,and 5 step process. For the purpose of this example, we are going to find and graph the bode plot of V(s)_out which is the voltage across the resister.
First write the equation as follows:

1) Put into our example equation for V(s) we have:

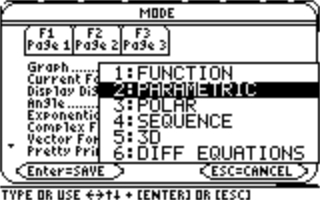
2) Change calculator to Parametric form:
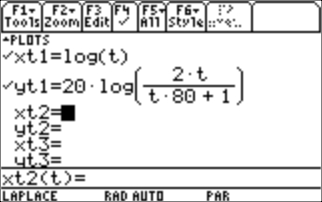
3) Define the x and y parameters in terms of calculator's "t":
(even though it is in the "s" domain, the calc uses "t")
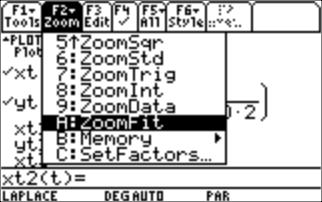
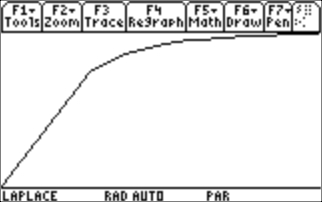
4) Select "Zoom" and then "ZoomFit" seems a good fit:
5) Finally, plot using (diamond+F3):
6) PLOT THE ANGLE:
Because S=jW, and I.C.=0,
HW#8
1) Frequency Magnitude via "Break Points and Asymptotes:"
If we take H(S), then:
When the numerator = 0, we a Break Point
When the denominator = 0, we have an Asymptotes

So we have Break Point at 
Asymptote at S=0
HW#9
HW#10
HW#11
State Equation Model
Take and put in the
HW#12
HW#13
HW#14
HW# END
I found this Youtube video on explaining the Smith Chart.
http://www.youtube.com/watch?v=WOaJyBpPfg0#watch-main-area
http://www.youtube.com/watch?v=VyD2EgyuV1A&feature=related
Smith Chart App
http://bessernet.com/jobaids/jsmith/jsmith.html


