PSK31 Demodulation (Kurt & Michael): Difference between revisions
No edit summary |
|||
| Line 76: | Line 76: | ||
<ol> |
<ol> |
||
<li>We read in the signal from a wav file and generate utility variables and matrices.</li> |
<li>We read in the signal from a wav file and generate utility variables and matrices.</li> |
||
<pre> |
|||
%% Decode Message |
|||
clear all |
|||
baud = 31.25; |
|||
% [v,Fs] = wavread('PSK31_sample.wav'); |
|||
% [v,Fs] = wavread('capture.wav'); |
|||
[v,Fs] = wavread('signal.wav'); |
|||
dt = 0:1/Fs:1/baud-1/Fs; % Time between samples |
|||
one = ones(size(dt)); % A 'One' signal |
|||
zero = cos(pi*dt*baud); % A 'Zero' signal |
|||
t = 0:1/(Fs):length(v)/Fs-1/Fs; |
|||
[sout charTable] = load_alpha(); |
|||
upperNoiseCutOff = .75; |
|||
lowerNoiseCutOff = 1-upperNoiseCutOff; |
|||
% figure(1) |
|||
% plot(v) |
|||
</pre> |
|||
<li>We run the signal through an FFT and take an average over the range of the FFT spike to obtain a carrier frequency guess.</li> |
<li>We run the signal through an FFT and take an average over the range of the FFT spike to obtain a carrier frequency guess.</li> |
||
<li>A PID controller was implemented to help offset the fact that a carrier frequency derived from the FFT produces an inaccurate carrier frequency. An offset in the carrier frequency causes the constellation diagram to rotate in a circle. The PID tries to compensate for this by adding to or subtracting from the phase of the signal while trying to drive the Q-component of the signal to zero. The feedback loop is described by the code below.</li> |
<li>A PID controller was implemented to help offset the fact that a carrier frequency derived from the FFT produces an inaccurate carrier frequency. An offset in the carrier frequency causes the constellation diagram to rotate in a circle. The PID tries to compensate for this by adding to or subtracting from the phase of the signal while trying to drive the Q-component of the signal to zero. The feedback loop is described by the code below.</li> |
||
Revision as of 22:21, 13 December 2012
Project Description
The goal of this project is to design and code a Matlab script that will encode and decode a PSK31 signal including signals with noise. The receiver should be able to read in signals (as a wav file) from other sources as well.
PSK31 is a audible text encoding that can be sent over the air by amateur radio operators. A computer's sound card can be used to send and receive the signal since the signal is audible. For more information regarding PSK31 see the Wikipedia article.[1]
Our Approach
Code Overview
Transmitter
Our code creates a PSK31 signal given an input carrier frequency and message. For testing our receiver code, the transmitter is setup to generate a random carrier frequency and phase. It also adds random noise to the signal before writing it to a wav file.
clear all

close all
clc

fc = 100+rand(1)*3900                 % Carrier Frequency
%fc = 1500;
Fs = 10000;                  % Sampling frequency
baud = 31.25;

%% Encode the message

phase = rand(1)*2*pi;                 % Phase of the signal
dt = 0:1/Fs:1/baud-1/Fs;   % Time between samples
one = ones(size(dt));       % A 'One' signal
zero = cos(pi*dt*baud);    % A 'Zero' signal

messageString = 'Hello World! The quick brown fox jumps over the lazy dog. ABCDEFGHIJKLMNOPQRSTUVWXYZ abcdefghijklmnopqrstuvwxyz 0123456789';
[message charTable] = make_bits(messageString);

baseband = [];
m=1;
for k = 1:length(message)
    if(message(k)==0)
        baseband = [baseband, zero*m];
        m=-m;
    else
        baseband = [baseband, one*m];
    end
end

t = 0:1/(Fs):length(baseband)/Fs-1/Fs;

v = baseband.*cos(2*pi*fc*t+phase);

% Noise
v = v+randn(size(v))*10^(-10/20);

wavwrite(v,Fs,'signal.wav');

figure(1)
subplot(2,1,1)
plot(t,baseband)
axis([0 2 -1.2 1.2])
title('\fontsize{14}Baseband')
xlabel('Time (s)')
ylabel('Amplitude')
subplot(2,1,2)
plot(t,v)
axis([0 2 -1.2 1.2])
title('\fontsize{14}Baseband with Carrier')
xlabel('Time (s)')
ylabel('Amplitude')
movegui('northwest')

Receiver
Our receiver is split into several steps:
- We read in the signal from a wav file and generate utility variables and matrices.
- We run the signal through an FFT and take an average over the range of the FFT spike to obtain a carrier frequency guess.
- A PID controller was implemented to help offset the fact that a carrier frequency derived from the FFT produces an inaccurate carrier frequency. An offset in the carrier frequency causes the constellation diagram to rotate in a circle. The PID tries to compensate for this by adding to or subtracting from the phase of the signal while trying to drive the Q-component of the signal to zero. The feedback loop is described by the code below.
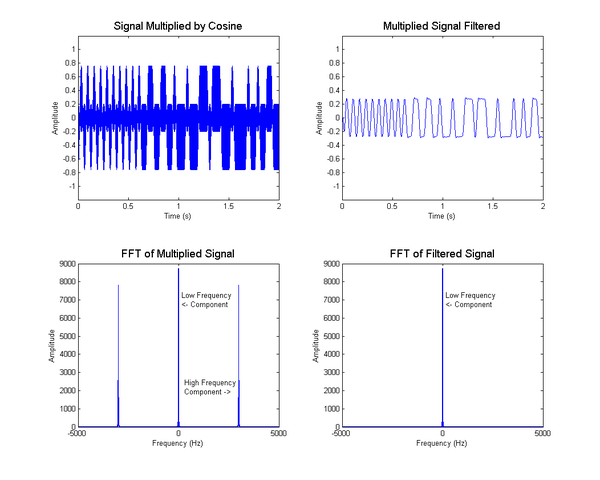
- We multiply the signal with a cosine wave at our guess frequency. This splits the signal into two parts: a high frequency component (with frequency equal to the sum of the actual carrier frequency and our guess frequency) and a low frequency component (due to the difference of the two frequencies).
- We filter the multiplied signal through a butterworth filter with a 75Hz cutoff frequency to remove the high frequency component.
- We mark the locations where the filtered signal changes sign. This identifies possible "sync" points where zeros in the signal may occur.
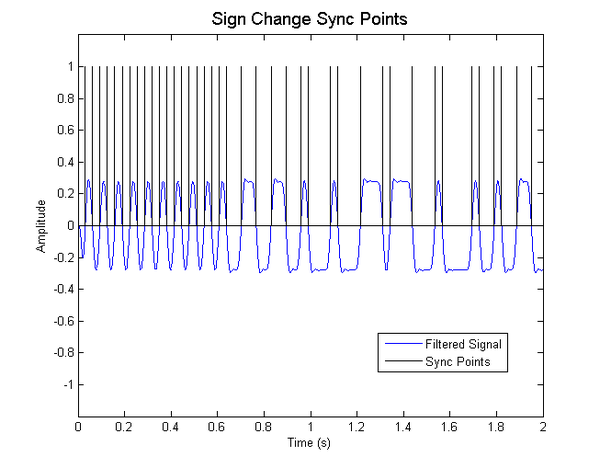
- We compare the length of time that occurs between each sync point with the baud rate to determine how many baud periods occur between each sync point. A single baud period indicates a zero. Each additional period over the first baud period indicates a one. (Ex. Three baud periods -> '110')
- We send the resulting bit stream through a text decoder which translates the ones and zeros into a text message.
%% Decode Message

clear all
baud = 31.25;

% [v,Fs] = wavread('PSK31_sample.wav');
% [v,Fs] = wavread('capture.wav');
[v,Fs] = wavread('signal.wav');

dt = 0:1/Fs:1/baud-1/Fs;   % Time between samples
one = ones(size(dt));       % A 'One' signal
zero = cos(pi*dt*baud);    % A 'Zero' signal
t = 0:1/(Fs):length(v)/Fs-1/Fs;

[sout charTable] = load_alpha();

upperNoiseCutOff = .75;
lowerNoiseCutOff = 1-upperNoiseCutOff;

% figure(1)
% plot(v)
 % PID controller constants
 Kp = 25;
 Ki = 50;
 Kd = 1;
 output = zeros(1, length(v));    % Init
 setpoint = 0;                    % Sets the feedback point to control to.
 previous_error = 0;                % In this case, you want to set yt to 0.
 integral = 0;
 xt_filt = [];
 yt_filt = [];
 for k=51:length(v)
    xt(k) = v(k)*cos(2*pi*u_fc*t(k)+output(k));
    yt(k) = v(k)*sin(2*pi*u_fc*t(k)+output(k));

    xt_filt(k:-1:k-50) = filter(b, a, xt(k:-1:k-50));
    yt_filt(k:-1:k-50) = filter(b, a, yt(k:-1:k-50));

    if(sign(xt(k)) == sign(yt(k)))
        error = setpoint - yt_filt(k);
    else
        error = setpoint + yt_filt(k);
    end

    % PID Feedback Controller compensates for inaccurate fc guess.
    % error = setpoint - yt_filt(k);
    integral = integral + error*10;
    derivative = (error - previous_error)/10;
    output(k+1) = Kp*error + Ki*integral + Kd*derivative;
    previous_error = error;
 end


Results/Problems
Transmitter
To our knowledge, our transmitter generates a signal without any problems.
Receiver
As long as our guess frequency is close to the actual frequency, (less than 0.1Hz off) our receiver can easily handle a 1dB SNR.
Frequency Errors
In most cases, our guess frequency is within 0.2Hz of the actual frequency. As the guess frequency exceeds these bounds, the text decode becomes increasingly garbled.
PID Controller Problems
The first iteration did not take into account the I component of the signal and was constantly trying to drive the signal to the positive I coordinates. A smiple if-else statement solved this problem. However there are some bugs. There might be a singularity at (0,0) which causes the controller to perform in a strange fashion. Also, the code has very bad noise rejection. It can produce baseband but not very well once noise is added. Finally, it doesn't decode signals that we generate ourselves. When we produce our signal in MATLAB, the code works fine. However, the signal from wikipedia.com and Dr. Frohne's signal don't work. One problem with the wikipedia.com signal is that it's native format is .ogg which is lossy. This could've presented problems when we convert the signal to a wave file as high frequencies get chopped in lossy formats.