HW12 DFT/Continuous Fourier Transform Relationship
Problem Statement
Use Matlab or Octave to show how the DFT is related to the actual Fourier Transform.
Solution
For those of you who recognize the squiggly codes of mathematical formulas, observe:
Here is the continuous Fourier Transform
Here is the Discrete Fourier Transform
In words, you may describe the Discrete Fourier Transform (DFT) as a "sampled"(see HW #8) Continuous Fourier Transform. The Discrete represents a finite amount of points on the continuous transform - enough so that you can reconstruct the signal to the correct amount of accuracy that you need, and prevent "aliasing"(see HW #11)
So why would you make a Discrete Fourier Transform? Why not just keep all the information you had in the first place with the continuous? Well, you could, you'd just need an infinite amount of memory on your computer to store the infinite amount of points on the continuous waveform. And that would leave no room for your precious Mp3's and movie files. You wouldn't want that, would you?
The Discrete Transform allows us to chop that bit ol' continuous ones into a bunch of ones and zeros that will fit on your computer along with your Vanilla Ice and Mariah Carey and Marilyn Manson Anthologies.
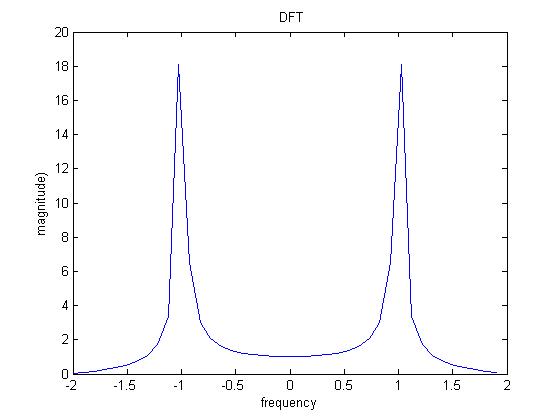
So what does this look like graphically? Well, basically, the Discrete is a bit less accurate on the frequencies it shows since by definition it is the sampled version of the continuous. So, if a simple sine wave is a particular frequency, it's continuous fourier transform (which, by definition, is a graph of the frequencies present in that wave) will spike at that particular frequency. The discrete frequency will also spike, but taper off a bit more gradually. Heres the what the DFT of a 1Hz Sine Wave looks like:
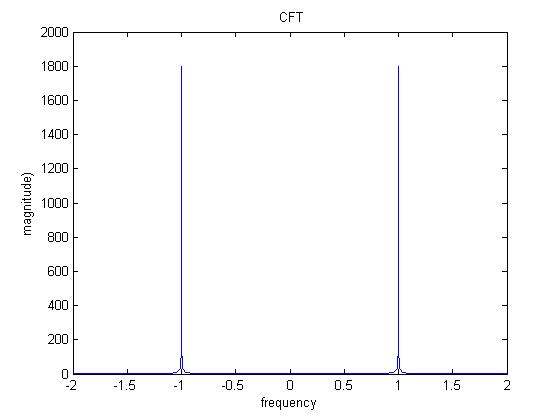
Heres the what the CFT of a 1Hz Sine Wave looks like, in comparison:
NOTE: The following Matlab script is not computatively correct - it was constructed to only get the graphs that pass visual inspection, not numerical inspection.
- DFT;
- clear;
- T=.25;
- t=(0:T:10);
- N=length(t);
- f = -1/(2*T):1/(N*T):1/(2*T)-1/(N*T);
- x=(sin(2*pi*t));
- y=abs(fft(x))
- figure(1);
- plot(f,y);
- title(' DFT')
- xlabel('frequency');
- ylabel('magnitude)');
- CFT;
- clear;
- T=.25;
- t=(0:T:1000);
- N=length(t);
- f = -1/(2*T):1/(N*T):1/(2*T)-1/(N*T);
- x=(sin(2*pi*t));
- y=abs(fft(x))
- figure(1);
- plot(f,y);
- title(' CFT')
- xlabel('frequency');
- ylabel('magnitude)');


