Mark's Article on Aliasing
Aliasing
Aliasing is the problem you get if you ignore Nyquist's theorem that says you must sample at least twice the fastest frequency.
MATLAB script
clear all;
f = 3; %sine wave frequency
fs = 2.5; %sample frequency
tmax = 2; %go to 5 seconds
T = 1/fs;
t = 0:0.001:tmax;
x = cos(2*pi*f*t);
ts = 0:T:tmax;
xs = cos(2*pi*f*ts);
xa = cos(2*pi*(f-fs)*t);
figure(1)
plot(t, x, '-b', ts, xs, 'ro', t, xa, 'g')
legend('Original signal', 'Sampled Points', 'Derived signal');
xlabel('Time (s)')
ylabel('Signal')
title('Plots Showing Aliasing')
Aliasing Displayed
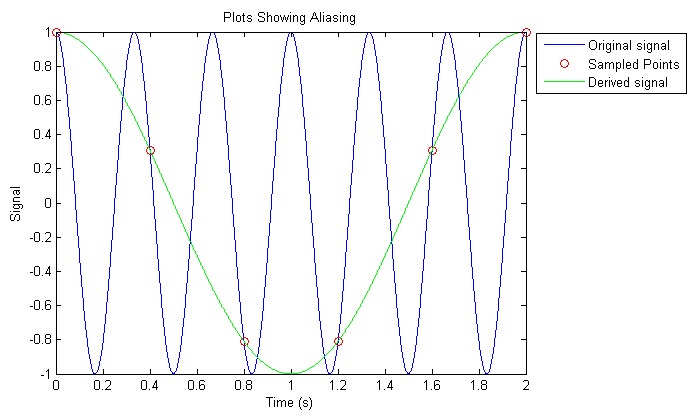
If you ran the above MATLAB script, MATLAB would display the following figure:
Aliasing Explained
In the MATLAB script, we generated a sine wave with a frequency of 3 (blue line). We then sampled the sine wave at a frequency of 2.5 (red circles). If we were to generate a sine wave from the sampled points, you'd get the green sine wave, which as you can tell, is not the same signal as the original! The frequency of the sine wave generated from the sample points would be:
Thus you have aliasing: your signal obtained from the sample points is very different from the original sine wave.
If you sample at twice the frequency of the original signal, the signal obtained from the sample points would be exactly the same as the original signal. If you sample even faster, you can apply a bandpass filter to still obtain the original signal. The given MATLAB script does not contain any such filter, so it would show you the wrong frequency sine wave if you tried values that are faster than twice the original frequency.

