ASN10 - Quadrature sampling demonstration: Difference between revisions
Jump to navigation
Jump to search
Jodi.Hodge (talk | contribs) No edit summary |
Jodi.Hodge (talk | contribs) No edit summary |
||
| Line 3: | Line 3: | ||
Assignment was actually done in class by professor. |
Assignment was actually done in class by professor. |
||
In Octave we were to plot <math> |
In Octave we were to plot <math> \frac{2}{T} \sum_{n=1}^\infty sin\bigg \frac{2 \pi nt}{T}\bigg) \!</math><br><br> |
||
Classmate [[Max Woesner ]] has also demonstrated it as shown below with similar code. |
Classmate [[Max Woesner ]] has also demonstrated it as shown below with similar code. |
||
Revision as of 12:23, 3 December 2009
Assignment was actually done in class by professor.
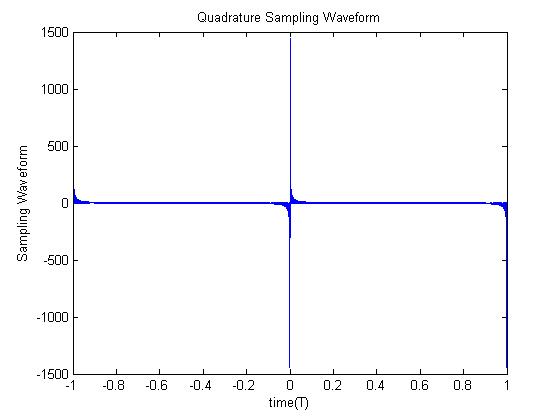
In Octave we were to plot Failed to parse (SVG with PNG fallback (MathML can be enabled via browser plugin): Invalid response ("Math extension cannot connect to Restbase.") from server "https://wikimedia.org/api/rest_v1/":): {\displaystyle \frac{2}{T} \sum_{n=1}^\infty sin\bigg \frac{2 \pi nt}{T}\bigg) \!}
Classmate Max Woesner has also demonstrated it as shown below with similar code.
clear all;
close all;
sum = 0;
T = 1;
t = -T:0.0001:T;
N = 1000;
for n = 1:N;
     if n==0
          h = 0;
     else
          h = 2/T;
     end
     sum = sum+h*sin(2*pi*n*t/T);
end
plot(t,sum)
title('Quadrature Sampling Waveform')
xlabel('time(T)')
ylabel('Sampling Waveform')
