Chris' Page on Aliasing using MatLab
(Redirected from Chris' Page on Nyquist using MatLab)
Demo of Aliasing Using Matlab
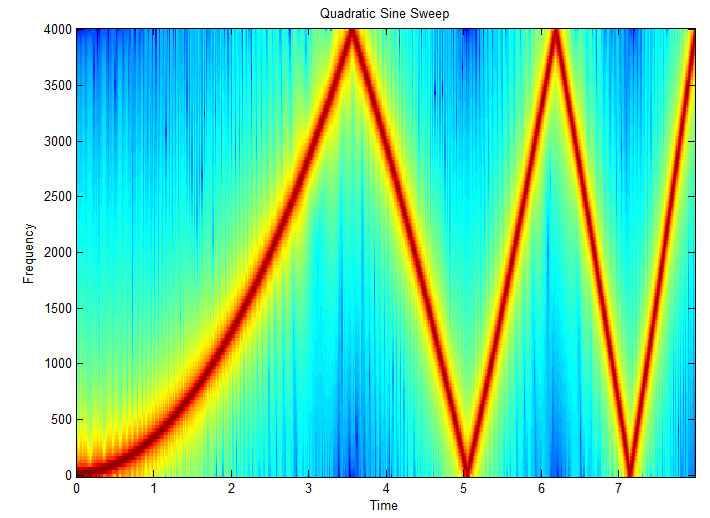
Frequencies above half the sample rate will produce aliasing. This should appear as a lower frequency signal.
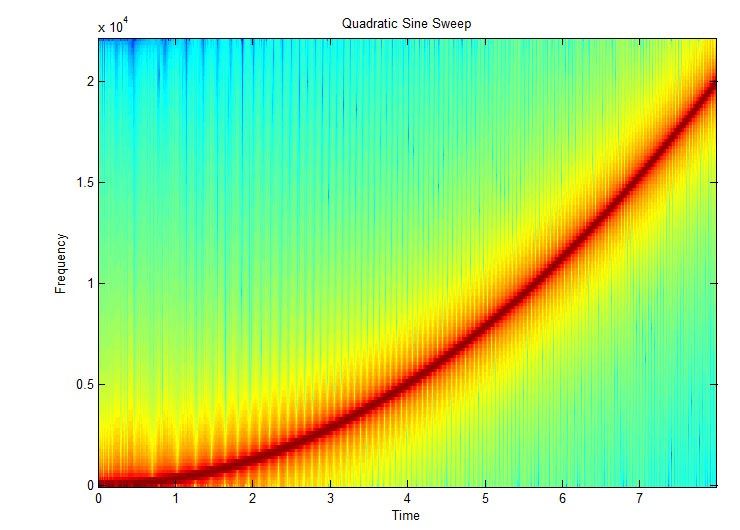
Below is a spectrogram of a quadratic sweep from 20 Hertz to 20,000 Hertz using a 441000 Hertz sample rate.
This one is the same script and parameters except the sample rate has been changed to 8000 Hertz.
Matlab Program
% Chris Rasmussen
% Based on Matlab examples
% Show aliasing

clc
%****************%
% Parameters
duration = 8
fmax = 20000
fmin = 20
samplerate = 8000
%****************%

%****************%
% Setup Soundcard
% Will still work if this is removed, you just won't hear anything
% It works with my onboard soundcard with Vista.
AO = analogoutput('winsound');
chan = addchannel(AO,1);
set(AO,'SampleRate',samplerate);
set(AO,'TriggerType','Manual');
ActualRate = get(AO,'SampleRate')
%****************%

%****************%
% Setup arrays
totalsamples = ActualRate*duration;
t = 0:1./ActualRate:duration;
y= 0.2 .* chirp(t,fmin,duration, fmax,'q',[],'concave');
%****************%

%****************%
% Write data to soundcard and play
% Will still work if this is removed, you just won't hear anything
putdata(AO,y')
start(AO)
trigger(AO)
waittilstop(AO,duration+1)
%****************%

%****************%
% Plot raw data
figure(1)
plot(y)
title('Waveform')
%****************%

%****************%
% Plot spectragram (uses FFT)
figure(3), specgram(y, 256, samplerate);
title('Quadratic Sine Sweep')
set(gcf,'Color',[1 1 1]);
%****************%

wavwrite(y,samplerate,16,'File.wav')

%****************%
% Picking up the messes
delete(AO)
clear AO
clear all

