Brian Haddad: Difference between revisions
Jump to navigation
Jump to search
Brian.haddad (talk | contribs) No edit summary |
Brian.haddad (talk | contribs) No edit summary |
||
| Line 10: | Line 10: | ||
== '''PSK31 Demodulation |
== '''PSK31 Demodulation''' == |
||
Fall, 2012 [[Image:PSK31_sample.png|thumb|200px|PSK31]] |
Fall, 2012 [[Image:PSK31_sample.png|thumb|200px|PSK31]] |
||
*Partner [[Denver Lodge]] |
*Partner [[Denver Lodge]] |
||
Revision as of 20:34, 12 December 2012
Contact Info:
Email: brian.haddad(AT)wallawalla(dot)edu
Articles Added:
PSK31 Demodulation
Fall, 2012
- Partner Denver Lodge
Abstract
- This project demodulates at least two PSK31 signals with limited phase shifting.The approach filters the signals to find the peaks and interpolate them to connect the maximums and form the wave. This decoder can handle up to two signals simultaneously and with the same message and phase, but with different carrier frequencies. The decoder can also handle well above .1dB down noise.
Introduction
- PSK31 was developed by Peter Martinez (G3PLX) in 1998. PSK31 varies in amplitude and phase, but not frequency. This is extremely useful in amateur radio. PSK31 uses Varicode; a unique binary alphabet where no letter can be found in another. A transmission begins with several zeros so the decoder can synchronize to the exact frequency. The continuous zeros phase shift at a rate of 31.25 per second; hence the name. Each character begins with a 'one', and ends with double zeros ('00'). When there is constant phase, it is considered to be a 'one', when the phase shifts, it is a 'zero'.
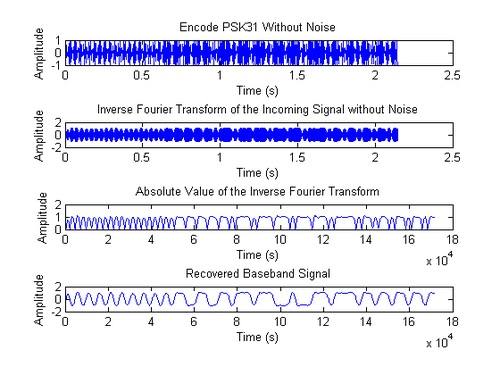
- Our project involved creating a "transmitter" to simulate a real signal that our decoder could identify the frequency and interpret the message. The transmitter uses a look-up-table to convert ascii characters to Varicode, then modulate the carrier frequency and add noise. The receiver does the same thing in reverse. The transmitter sends two signals simultaneously. At the moment, both signals have the same message and phase, but are transmitted on separate carrier frequencies. Very little improvement is needed to improve the decoder so it can receive multiple messages and phases simultaneously. To simulate a real signal, the signal is written to a .wav file to be read by the decoder. This ends the transmitter portion. The decoder begins by reading the .wav file and sending it to a Fourier transform so we can locate the frequencies the signal is transmitting on. Once the frequencies are determined, the signal goes through a bandpass filter at one of the identified carrier frequencies to remove the noise associated with it. The next step is finds the peaks of the signal or local maxima, and interpolates them to create a wave. (Figure 1, plot 3) shows the signal at this stage. Next, find the local minima and mirror it over the t-axis from that point to the end of the transmission(Figure 1, plot 4).
Matlab Script
- Matlab Script:
- BSD license
   % This section highlights the code. For the entire script, use the link above.
   %
   %     This project is written by Brian Haddad and Denver Lodge.
   % This is the main script in Matlab that will call different scripts
   %               with more specific functionality.
   %
   % PSK31 was developed by Peter Martinez...
   % ...
   % Global Variables
   %--------------------------------------------------------
   message = ('Hello');      % <----- enter your message
   message = [message,'     '];    % Appends spaces to the end for accuracy
   phrase = message;
   phase = 2*pi()*rand(1);         %50.000*3.14159/100;
   Fs    = 80000;                   % Sample Rate
   fc    = 100;                   % Carrier Frequency
   fc1   = 4000;
   n     = 0.0;                    % Pause time (seconds)
   N     = 32;                     % wavwrite N-bit (8,16,24,32)
   noise = 3*10^(-10/20)             %= 10 db down
   frequencychoice=2
   % -----------Variables from other scripts----------------
   [t,v] = encode_psk31(message,phase,Fs,fc);
   [t1,v1]  = encode_psk31(phrase,phase,Fs,fc1);
   %[t2,v2]  = encode_psk31(phrase,phase,Fs,);
   %[bitstream] = demod_to_bitstream(v,Fs);
   %--------------------------------------------------------
   % ...
   finv_spec = ifft(spec);
   [z]=findfreqs(v,Fs,200,.5);
   z
   bandsize=140*Fs/length(spec);
   z=z-bandsize/2;
   z2=z+bandsize;
   W=2.*[z' z2']./Fs
   %use corner frequencies to filter the signal.
   Wn=W(frequencychoice,:)
   [b,a]=butter(3,Wn);
   %[b,a]=cheby1(3,.5,Wn);
   finv=filter(b,a,v);
   absfinv=abs(finv);
   % ...
   percent=percent*100/length(bits);     % Displays the percentage of accuracy
   percent                               % from the inbits to the outbits
   outbits(1:15)
   make_msg(inbits)
   make_msg(outbits)
   t0 = 0:1/Fs:1/31.25-1/Fs;
   one = ones(size(t0));
   zero = cos(pi*t0*31.25);
Matlab Plots
- These are the plots
- Figure 1 shows the process of the decoder.
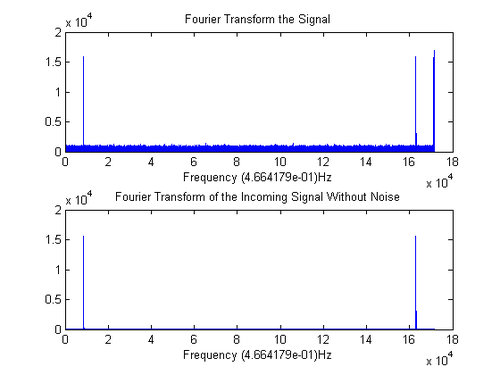
- Figure 2 shows he Fourier transform of the signal; first with noise, then without. These graphs help identify the carrier frequencies.
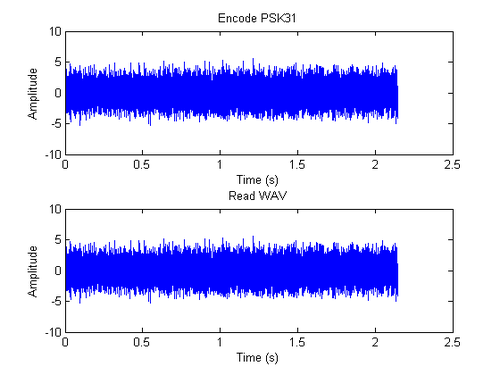
- Figure 3 shows that the signal being sent to the wave file by the transmitter, is the same as the one being read by the decoder.
Results
- The end.
Special Thanks
- Dr. Rob Frohne
- Dick Benson


