Alias: Difference between revisions
No edit summary |
No edit summary |
||
| (4 intermediate revisions by the same user not shown) | |||
| Line 1: | Line 1: | ||
[[User:Harrde|Back to my page]] | [[User:Harrde|Back to my page]] | ||
[[Image: | ==Aliasing== | ||
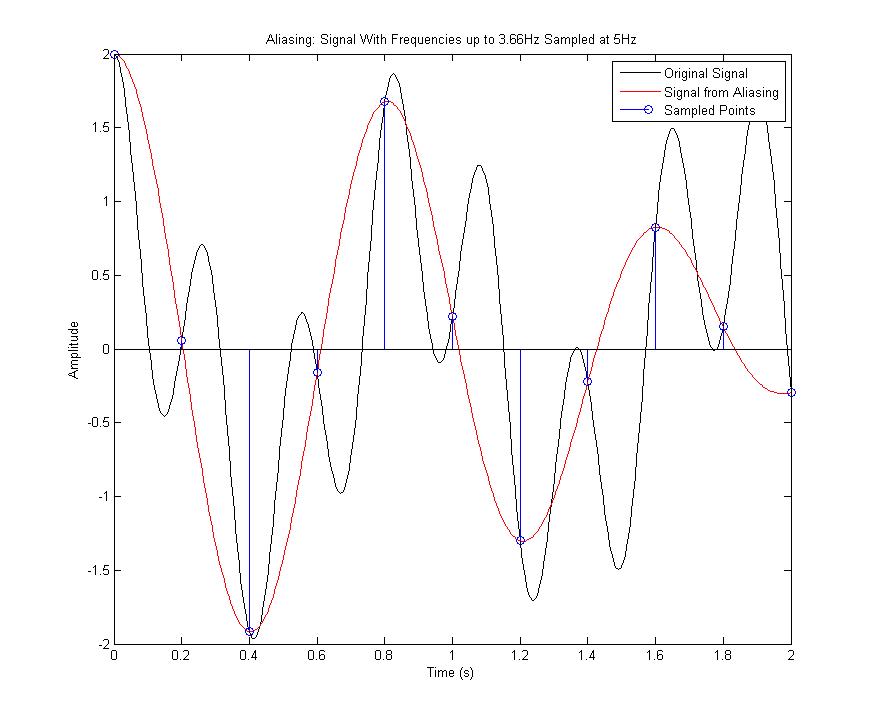
The Nyquist Theorem states that you must sample at a frequency which is twice that of the highest frequency components of the sampled signal in order to recover the sampled signal. If you sample at rate lower than this, you get aliasing. Below is a figure which shows how aliasing occurs and the Matlab code for it. | |||
[[Image:harrdeH11Fig.jpg]] | |||
<pre> | |||
clear all; | |||
Ts = .2; %Sampling time (s) | |||
ws = 2*pi/Ts; %Sampling frequency (rad/s) | |||
t = [0:0.005:2]; %Time vector | |||
w1 = 7; w2 = 23; | |||
y = cos(w1*t) + cos(w2*t); %Original Signal | |||
t1 = [0:Ts:2]; | |||
xs = cos(w1*t1) + cos(w2*t1); %Sampled points | |||
w2s = w2 - ws; | |||
x1 = cos(w1*t) + cos(w2s*t); %Signal from Aliasing | |||
figure(1); %Plot | |||
clf; | |||
plot(t,y,'k',t,x1,'r'); | |||
hold on | |||
stem(t1,xs); | |||
hold off; | |||
legend('Original Signal', 'Signal from Aliasing', 'Sampled Points'); | |||
xlabel('Time (s)'); | |||
ylabel('Amplitude'); | |||
title('Aliasing: Signal With Frequencies up to 3.66Hz Sampled at 5Hz'); | |||
</pre> | |||
The figure above shows that if the original signal (black) is not sampled fast enough then another signal (blue) can be incorrectly "recovered" which passes through all the sampled points but is clearly not the same as the orignal signal. This incorrect signal from aliasing has correct frequency components for those components which are lower then half the sampling frequency. The components which are higher than half the sampling frequency end up with frequencies equal to the original signals' frequency components minus the sampling frequency. | |||
It should be noted that other signals can be found that pass through each of the sampled points, but their incorrect frequency components will all have frequencies higher than the original signals' highest frequency components. Thus, they can be easily filter out by a low pass filter. | |||
Latest revision as of 13:18, 11 November 2007
Aliasing
The Nyquist Theorem states that you must sample at a frequency which is twice that of the highest frequency components of the sampled signal in order to recover the sampled signal. If you sample at rate lower than this, you get aliasing. Below is a figure which shows how aliasing occurs and the Matlab code for it.
clear all;

Ts = .2;                       %Sampling time (s)
ws = 2*pi/Ts;                   %Sampling frequency (rad/s)

t = [0:0.005:2];                %Time vector

w1 = 7; w2 = 23;
y = cos(w1*t) + cos(w2*t);      %Original Signal

t1 = [0:Ts:2];
xs = cos(w1*t1) + cos(w2*t1);   %Sampled points

w2s = w2 - ws;
x1 = cos(w1*t) + cos(w2s*t);    %Signal from Aliasing

figure(1);                      %Plot
clf;
plot(t,y,'k',t,x1,'r');
hold on
stem(t1,xs);
hold off;
legend('Original Signal', 'Signal from Aliasing', 'Sampled Points');
xlabel('Time (s)');
ylabel('Amplitude');
title('Aliasing: Signal With Frequencies up to 3.66Hz Sampled at 5Hz');
The figure above shows that if the original signal (black) is not sampled fast enough then another signal (blue) can be incorrectly "recovered" which passes through all the sampled points but is clearly not the same as the orignal signal. This incorrect signal from aliasing has correct frequency components for those components which are lower then half the sampling frequency. The components which are higher than half the sampling frequency end up with frequencies equal to the original signals' frequency components minus the sampling frequency.
It should be noted that other signals can be found that pass through each of the sampled points, but their incorrect frequency components will all have frequencies higher than the original signals' highest frequency components. Thus, they can be easily filter out by a low pass filter.
