11 - DFT example: Difference between revisions
Jump to navigation
Jump to search
No edit summary |
No edit summary |
||
| (One intermediate revision by the same user not shown) | |||
| Line 21: | Line 21: | ||
c = [a b] | c = [a b] | ||
plot(c) | plot(c) | ||
[[Image:Crosscorr.jpg]] | |||
This when using this in real life it can be used to shift to incoming signals together to create a stronger signal =D. | |||
Latest revision as of 20:27, 14 December 2009
Do an example using matlab of a DFT
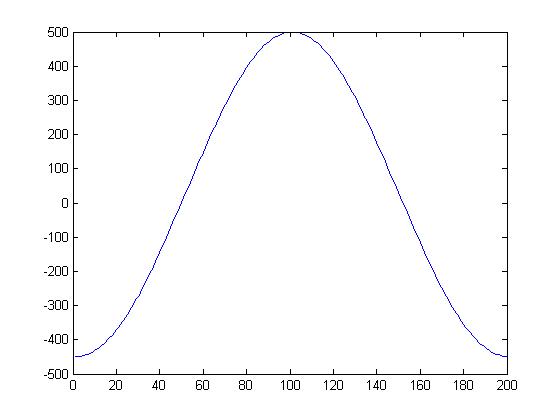
For my example I looked into cross correlation. We needed this for our project so it seemed appropriate. To test this I created a sin wave and shifted it over by 100 zeros then I shifted the original function one zero at a time toward my new function each time taking the dot product between the two. As expected and seen in the graph the peak was when I had shifted it 100 times then the curve went back down as it shifted past that point.
   close all;
   clear all;
   N = 100;
   t = 0:1000;
   song1 = sin(t*pi/100);
   song2 = [zeros(1,N) song1]';
   song1 = [song1 zeros(1,N)]';
   for n = 1:N
       a(n) = song1'*song2;
       song1 = circshift(song1,1);
   end
   for x = 1:N
       b(x) = song1'*song2;
       song1 = circshift(song1,1);
   end
   c = [a b]
   plot(c)
This when using this in real life it can be used to shift to incoming signals together to create a stronger signal =D.
