File:LowPass.png: Difference between revisions
Jump to navigation
Jump to search
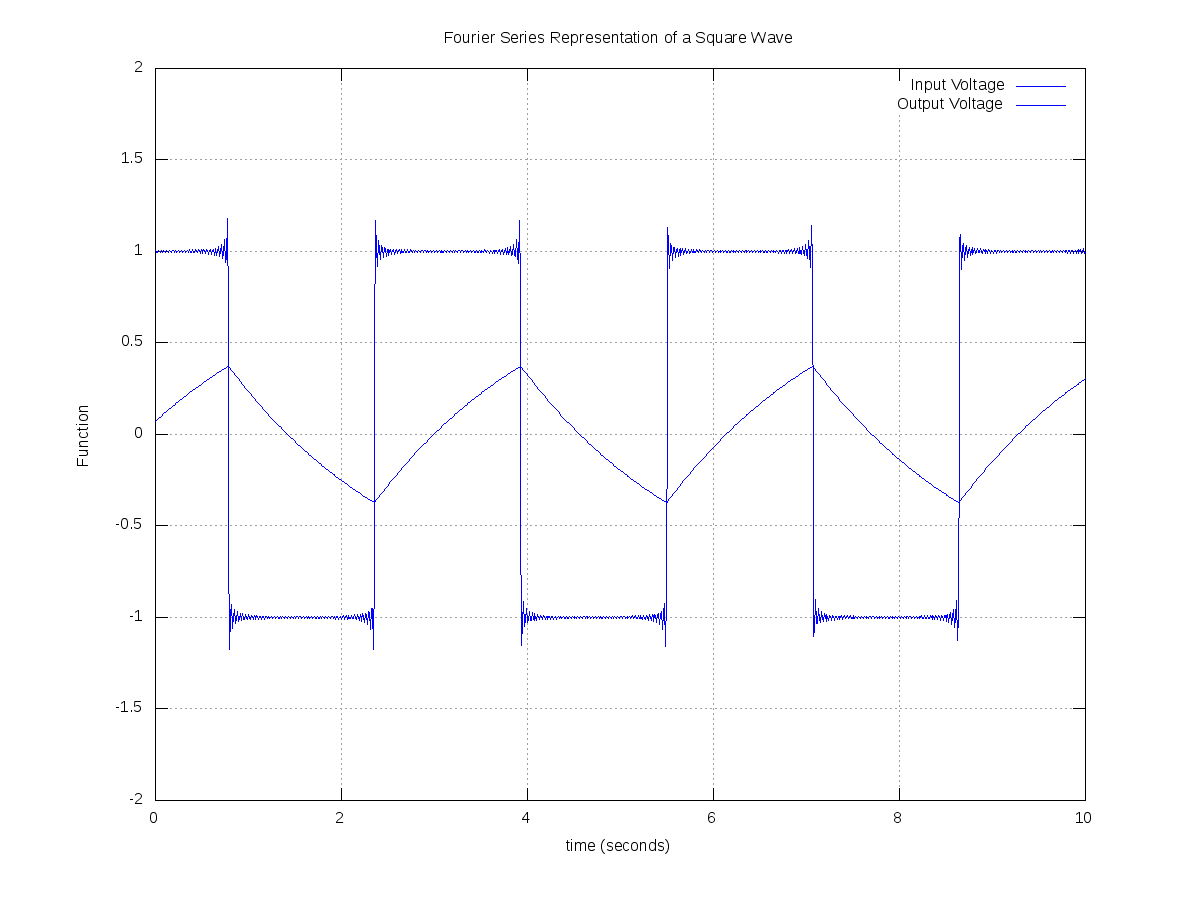
This plot shows the input and output waveforms for the low pass filter. |
(No difference)
|
Latest revision as of 16:54, 6 October 2010
This plot shows the input and output waveforms for the low pass filter.
File history
Click on a date/time to view the file as it appeared at that time.
| Date/Time | Thumbnail | Dimensions | User | Comment | |
|---|---|---|---|---|---|
| current | 16:54, 6 October 2010 | Error creating thumbnail: File missing | 1,200 × 900 (15 KB) | Frohro (talk | contribs) | This plot shows the input and output waveforms for the low pass filter. |
File usage
The following page uses this file: