DFT by harrde: Difference between revisions
Jump to navigation
Jump to search
New page: Back to my page |
No edit summary |
||
| (2 intermediate revisions by the same user not shown) | |||
| Line 1: | Line 1: | ||
[[User:Harrde|Back to my page]] | [[User:Harrde|Back to my page]] | ||
===Problem Statement=== | |||
Use MATLAB, OCTAVE, or SCILAB to show how the DFT is related to the actual Fourier Transform. | |||
===Solution=== | |||
MATLAB code and results: | |||
<pre> | |||
f = 5; % Sampling freq. | |||
T = 1/f; % Sampling period | |||
t = 0:.01:5; | |||
N2 = 100; % Number of sampling points | |||
N3 = 30; | |||
t2 = 0:T:N2*T; | |||
t3 = 0:T:N3*T; | |||
x = sin(2*pi*t); % Signal that is sampled | |||
x2 = sin(2*pi*t2); | |||
X2 = fft(x2); % DFT of signal | |||
figure(1) %Original signal with sampling | |||
plot(t(1:300), x(1:300), 'r') | |||
hold on | |||
stem(t2(1:15), x2(1:15)); | |||
hold off; | |||
xlabel('Time (s)') | |||
ylabel('x(t)') | |||
title('Input Signal With Sampling') | |||
legend('Original signal', 'Sampled signal'); | |||
figure(2) %DFT | |||
plot(t2/(N2*T*T),abs(X2)) | |||
xlabel('Frequency (s)') | |||
ylabel('X(F)') | |||
title('DFT') | |||
figure(3) % Shifted DFT | |||
XS2=fftshift(X2); | |||
f2=-1/(2*T):1/(N2*T):1/(2*T); | |||
plot(f2,abs(XS2)) | |||
xlabel('Frequency (s)') | |||
ylabel('X(F)') | |||
title('Shifted DFT') | |||
</pre> | |||
[[Image:DH12_1.jpg]] | |||
[[Image:DH12_2.jpg]] | |||
[[Image:DH12_3.jpg]] | |||
===Explaination=== | |||
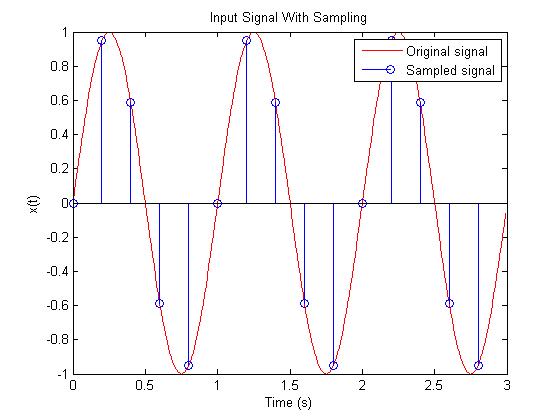
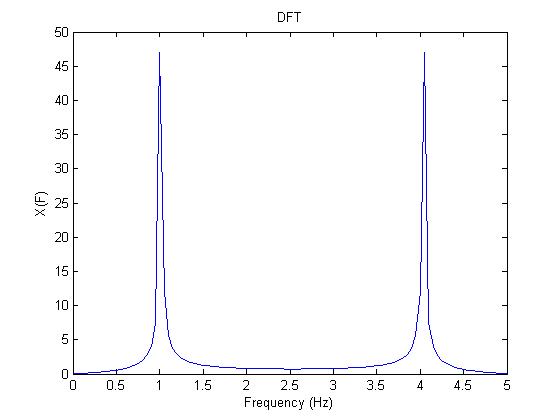
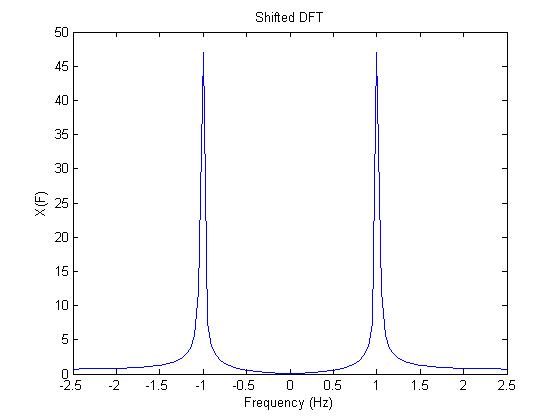
From the graphs above we see that the DFT is similar to the real Fourier Transform but is only an approximation. The actual Fourier Transform of an input signal with a single frequency F would simply have impulses of infinite height at the positive and negative frequency F. But as seen in this example the DFT only gives impulse like "spikes" that have a height of about 48. Furthermore, without shifting the DFT the "spike" on the left is at the right frequency but the one on the left is not. But as shown, a simple shift takes care of this latter problem. | |||
Latest revision as of 23:19, 6 December 2007
Problem Statement
Use MATLAB, OCTAVE, or SCILAB to show how the DFT is related to the actual Fourier Transform.
Solution
MATLAB code and results:
f = 5;              % Sampling freq.
T = 1/f;            % Sampling period
t = 0:.01:5;
N2 = 100;          % Number of sampling points
N3 = 30;
t2 = 0:T:N2*T;
t3 = 0:T:N3*T;

x = sin(2*pi*t);    % Signal that is sampled
x2 = sin(2*pi*t2);

X2 = fft(x2);         % DFT of signal

figure(1)                    %Original signal with sampling
plot(t(1:300), x(1:300), 'r')
hold on
stem(t2(1:15), x2(1:15));
hold off;
xlabel('Time (s)')
ylabel('x(t)')
title('Input Signal With Sampling')
legend('Original signal', 'Sampled signal');

figure(2)                    %DFT
plot(t2/(N2*T*T),abs(X2))
xlabel('Frequency (s)')
ylabel('X(F)')
title('DFT')

figure(3)                   % Shifted DFT
XS2=fftshift(X2);
f2=-1/(2*T):1/(N2*T):1/(2*T);
plot(f2,abs(XS2))
xlabel('Frequency (s)')
ylabel('X(F)')
title('Shifted DFT')
Explaination
From the graphs above we see that the DFT is similar to the real Fourier Transform but is only an approximation. The actual Fourier Transform of an input signal with a single frequency F would simply have impulses of infinite height at the positive and negative frequency F. But as seen in this example the DFT only gives impulse like "spikes" that have a height of about 48. Furthermore, without shifting the DFT the "spike" on the left is at the right frequency but the one on the left is not. But as shown, a simple shift takes care of this latter problem.


