HW10: Difference between revisions
No edit summary |
No edit summary |
||
| (3 intermediate revisions by the same user not shown) | |||
| Line 6: | Line 6: | ||
I decided to show a cross correlation example using MATLAB. | I decided to show a cross correlation example using MATLAB. | ||
About cross correlation: | |||
First of all correlation is defined as<br> | |||
[[image:Img1204.png]]<br> | |||
We may interpret the correlation operator as | |||
which is <math>||x||^2=N </math> times the coefficient of projection onto x of y advanced by n samples (shifted circularly to the left by n samples). The time shift n is called the correlation lag, and the function is called a lagged product. | |||
This is then used to define cross correlation as <br> | |||
[[image:Img1541.png]] | |||
The term ``cross-correlation'' comes from statistics, and what is defined here is more properly called a ``sample cross-correlation.'' | |||
This definition of a sample cross-correlation is only valid for stationary stochastic processes, e.g., ``steady noises'' that sound unchanged over time. The statistics of a stationary stochastic process are by definition time invariant, thereby allowing time-averages to be used for estimating statistics such as cross-correlations. For brevity below, we will typically not include ``sample'' qualifier, because all computational methods discussed will be sample-based methods intended for use on stationary data segments. | |||
The DFT of the cross-correlation may be called the cross-spectral density, or ``cross-power spectrum,'' or even simply ``cross-spectrum'': <br> | |||
[[image:Img1544.png]] | |||
Matlab has a cross correlation function "xcorr()" but I am not familiar with it and could only find an example on Matlab's website using the following format, it was different in that it didnt have any example signals but gave an outline on defining the matrix's and how they should relate to one another to work. | |||
| Line 26: | Line 46: | ||
sigC = real(ifft(sigA.*sigB));</pre> | sigC = real(ifft(sigA.*sigB));</pre> | ||
cross correlatoin of same wave<br> | |||
[[image:Same_wave.jpg]] | |||
cross correlation with 90degree delay<br> | |||
[[image:90degree_shift.jpg]] | |||
cross correlation with 45 degree delay<br> | |||
[[image:45shift.jpb | |||
cross correlation with <math>\frac{\pi}{1000}</math><br> | |||
[[image:Pi_onethousanths_shift.jpg]] | |||
Latest revision as of 22:33, 2 December 2009
Problem Statement
Present an Octave (or MATLAB) example using the discrete Fourier transform (DFT).
Solution
I decided to show a cross correlation example using MATLAB.
About cross correlation:
First of all correlation is defined as

We may interpret the correlation operator as
which is times the coefficient of projection onto x of y advanced by n samples (shifted circularly to the left by n samples). The time shift n is called the correlation lag, and the function is called a lagged product.
This is then used to define cross correlation as

The term ``cross-correlation comes from statistics, and what is defined here is more properly called a ``sample cross-correlation.
This definition of a sample cross-correlation is only valid for stationary stochastic processes, e.g., ``steady noises that sound unchanged over time. The statistics of a stationary stochastic process are by definition time invariant, thereby allowing time-averages to be used for estimating statistics such as cross-correlations. For brevity below, we will typically not include ``sample qualifier, because all computational methods discussed will be sample-based methods intended for use on stationary data segments.
The DFT of the cross-correlation may be called the cross-spectral density, or ``cross-power spectrum, or even simply ``cross-spectrum:

Matlab has a cross correlation function "xcorr()" but I am not familiar with it and could only find an example on Matlab's website using the following format, it was different in that it didnt have any example signals but gave an outline on defining the matrix's and how they should relate to one another to work.
close all
clear all
f = 2; % sine wave frequency
tmax = 2; % go to 2 seconds
theta = pi/4;
T = 0.01;
t = 0:T:tmax;
N = length(t);
Nmat = 0:N-2;
Zmat = Nmat *0;
sig1 = sin(2*pi*f*t); % A alpha signal
sig2 = sin(2*pi*f*t); % A beta signal
c= conv(sig1,sig2); %test of matrix size
%zeropad both vectors to length N1+N2-1 to avoid cyclic convolution
sigA = fft([sig1 Zmat]);
sigB = fft([sig2 Zmat]);
sigC = real(ifft(sigA.*sigB));
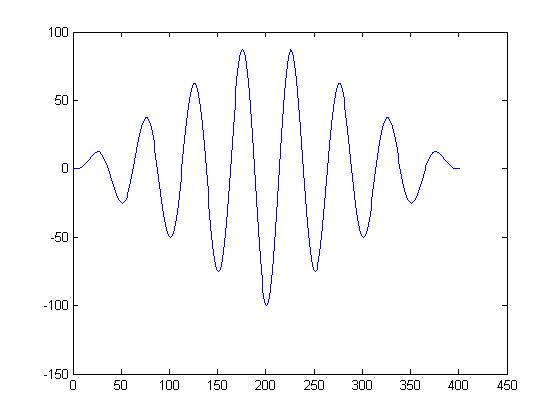
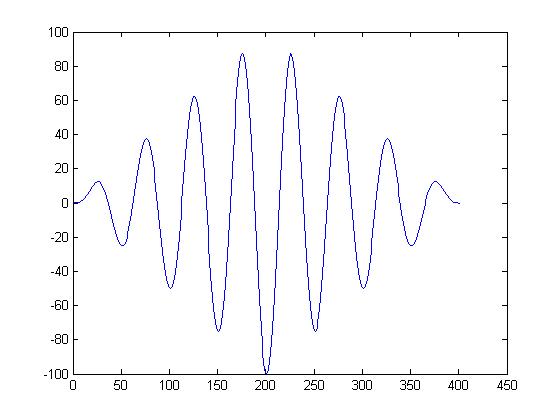
cross correlatoin of same wave

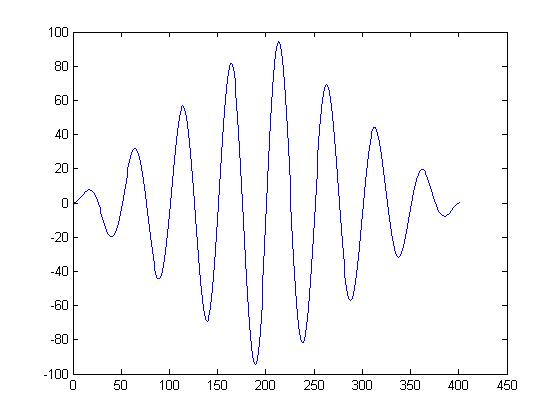
cross correlation with 90degree delay

cross correlation with 45 degree delay
[[image:45shift.jpb
