Matthew Blaire: Difference between revisions
Jump to navigation
Jump to search
Btheredude (talk | contribs) No edit summary |
Btheredude (talk | contribs) No edit summary |
||
| Line 20: | Line 20: | ||
This is the Graph of the simulation, you can see that the data is passed in a better range and that the wave form of the slower wave data is taken from the faster data. | This is the Graph of the simulation, you can see that the data is passed in a better range and that the wave form of the slower wave data is taken from the faster data. | ||
[[File:limit_on_bottom.gif|center|alt=A graph]] | [[File:limit_on_bottom.gif|center|alt=A graph]] | ||
There is still some distortion at the bottom of the graph but overall I think this passes better data than putting the oscillator on the top. If the transistors were biased better, I think that the data would show a little better. | |||
Revision as of 01:01, 8 June 2011
Info:
 Email: matthew.blaire@wallawalla.edu
        b.there.dude@gmail.com
Phone: 303-815-5651
 LTspice Mixer Analysis:
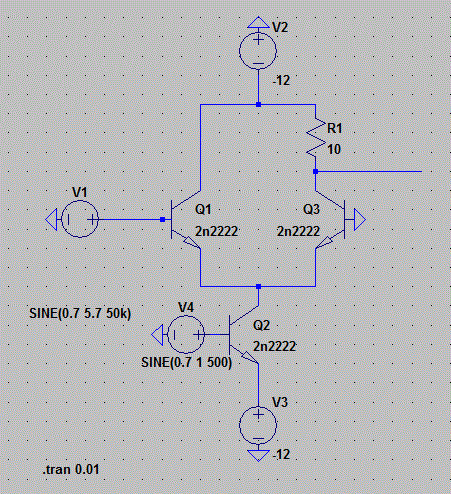
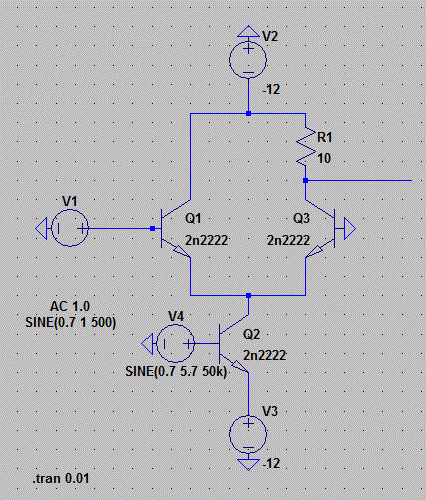
  What I basically did was I took the basic differential amplifier design and tested
    the inputs with the two different designs: one with the data coming in through the
    top transistor, and one where the data comes in through the bottom input. The pdf
    diagramming the setups are displayed below.
The following is a schematic with the data coming in the top Transistor.

The following is the simulation of the data.

You can see that some of the data is limited by the bottom resistor so this is not as good as the other way of which the simulation is done below.

This is the Graph of the simulation, you can see that the data is passed in a better range and that the wave form of the slower wave data is taken from the faster data.

There is still some distortion at the bottom of the graph but overall I think this passes better data than putting the oscillator on the top. If the transistors were biased better, I think that the data would show a little better.