Hw3: Difference between revisions
Jump to navigation
Jump to search
Created page with 'Show graphically int You can either type this code straight into octave or matlab, or you can save it as a [name_of_file].m and loading it to the software. octave:1> t= -5:.01…' |
No edit summary |
||
| Line 1: | Line 1: | ||
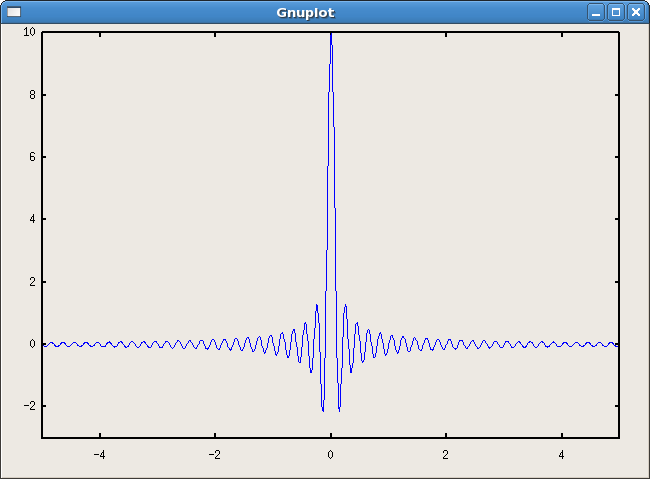
Show graphically | Show graphically that <math> \int_{-\infty}^{\infty} e^{j2\pi f(t-u)}\, df = \delta (t-u)</math> | ||
You can either type this code straight into octave or matlab, or you can save it as a [name_of_file].m and loading it to the software. | You can either type this code straight into octave or matlab, or you can save it as a [name_of_file].m and loading it to the software. | ||
| Line 10: | Line 10: | ||
octave:6> one1=.001*trapz(delta); | octave:6> one1=.001*trapz(delta); | ||
octave:7> plot(t,delta); | octave:7> plot(t,delta); | ||
This is what the graph looks like. | |||
[[image:Gnuplot.png]] | |||
Revision as of 16:43, 15 October 2010
Show graphically that
You can either type this code straight into octave or matlab, or you can save it as a [name_of_file].m and loading it to the software.
octave:1> t= -5:.01:5;
octave:2> f=t;
octave:3> [ff,tt]=meshgrid(f,t);
octave:4> r=exp(j*2*pi.*ff.*tt);
octave:5> delta=trapz(r)*.01;
octave:6> one1=.001*trapz(delta);
octave:7> plot(t,delta);
This is what the graph looks like.
