DFT Exploration by harrde
Problem Statement
Sample at 3Hz, take the DFT, and explain the results.
Solution
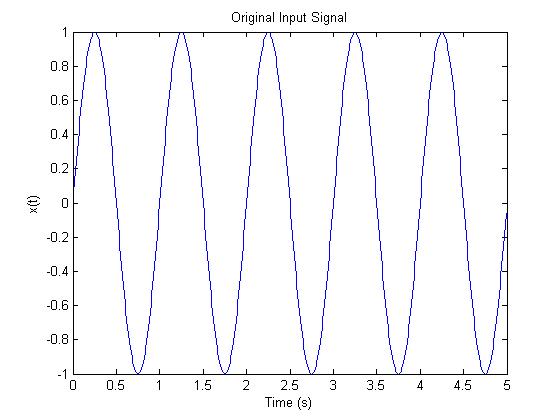
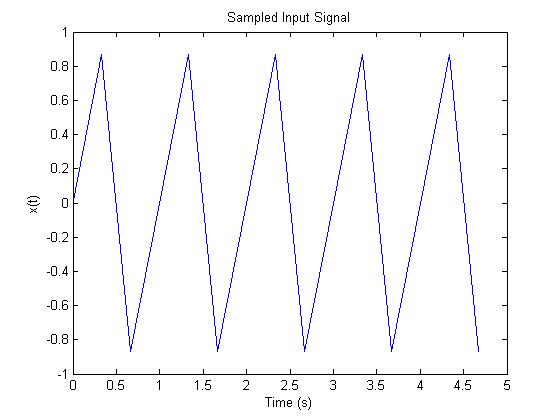
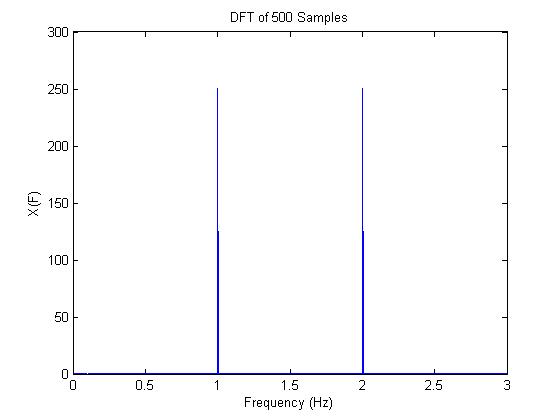
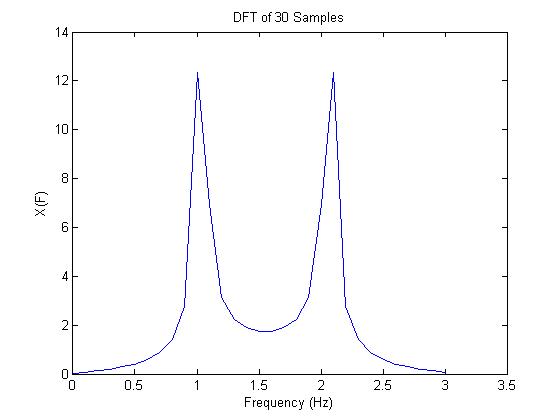
Here is the MATLAB code and resulting figures:
f = 3;              % Sampling freq.
T = 1/f;            % Sampling period
t = 0:.01:5;
N2 = 500;          % Number of sampling points
N3 = 30;
t2 = 0:T:N2*T;
t3 = 0:T:N3*T;

x = sin(2*pi*t);    % Signal that is sampled
x2 = sin(2*pi*t2);
x3 = sin(2*pi*t3);

X2 = fft(x2);         % DFT of long signal
X3 = fft(x3);         % DFT of short signal

figure(1)                    %Original signal
plot(t(1:500),x(1:500))
xlabel('Time (s)')
ylabel('x(t)')
title('Original Input Signal')

figure(2)
plot(t2(1:15),x2(1:15))      % Sampled signal
xlabel('Time (s)')
ylabel('x(t)')
title('Sampled Input Signal')

figure(3)                    %DFT of long signal
plot(t2/(N2*T*T),abs(X2))
xlabel('Frequency (s)')
ylabel('X(F)')
title('DFT of 500 Samples')

figure(4)                    % DFT of short signal
plot(t3/(N3*T*T),abs(X3))
xlabel('Frequency (s)')
ylabel('X(F)')
title('DFT of 30 Samples')

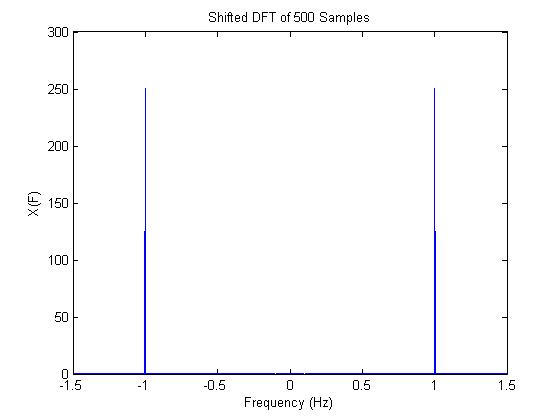
figure(5)                   % Shifted DFT of long signal
XS2=fftshift(X2);
f2=-1/(2*T):1/(N2*T):1/(2*T);
plot(f2,abs(XS2))
xlabel('Frequency (s)')
ylabel('X(F)')
title('Shifted DFT of 500 Samples')

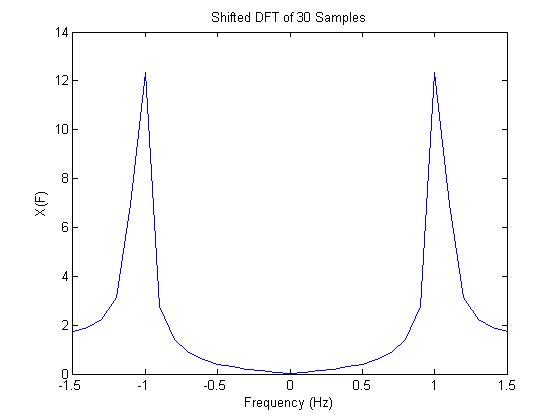
figure(6)                   % Shifted DFT of short signal
XS3=fftshift(X3);
f3=-1/(2*T):1/(N3*T):1/(2*T);
plot(f3,abs(XS3))
xlabel('Frequency (s)')
ylabel('X(F)')
title('Shifted DFT of 30 Samples')
