A octave/MATLAB script to show how Nyquist's formula
Jump to navigation
Jump to search
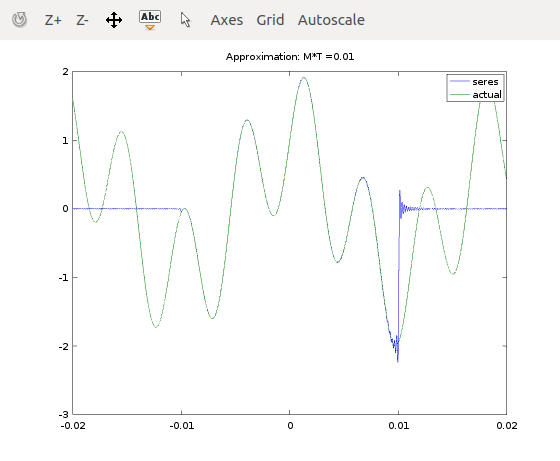
Nyquist showed that if the function was band limited to less than Hz, then it could be represented by . This octave script plots this for finite values of in the sum, .
% This is a script to check Nyquist's formula giving a low pass
% function as a function of its sample points, x(kT).
% Note that the approximation is pretty good for -M*T<t<M*T.
M=100; % Number of terms
T=1e-4;
Tf=.02;

function x0 = x(t0)
x0=sin(2*pi*180*t0)+cos(2*pi*50*t0);
endfunction
t=-Tf:T/1000:Tf;
x1=zeros(size(t));
for k=-M:M
  x1 = x1 + x(k*T).*sinc((t-k*T)/T);
end
plot(t,x1,t,x(t))
title(strcat('Approximation: M*T =',num2str(M*T)))
legend('seres','actual')
It is interesting that form an orthogonal basis set. (The easiest way to see this is to do the inner product in frequency space between the nth and kth sinc function where they look like the Fourier basis set, and note that if the inner product is zero in one space it is also zero in the other space.)
