Automatic Antenna Phasing Project: Difference between revisions
Max.Woesner (talk | contribs) New page: == Max Woesner == Back to my Home Page === Class Project - Automatic Antenna Phasing === <br><b>Problem Statement</b><br> Design and implement an algorithm to determine t... |
Max.Woesner (talk | contribs) No edit summary |
||
| (8 intermediate revisions by 2 users not shown) | |||
| Line 3: | Line 3: | ||
=== Class Project - Automatic Antenna Phasing === | === Class Project - Automatic Antenna Phasing === | ||
====Team Members:==== | |||
[[Joshua Sarris]]<br> | |||
[[Kevin Starkey]]<br> | |||
[[Max Woesner]]<br> | |||
[[Nick Christman]] | |||
<br><b>Problem Statement</b><br> | <br><b>Problem Statement</b><br> | ||
Design and implement an algorithm to determine the amount of delay necessary to automatically add two signals from different antennas in phase. Also determine the relative amplitudes of the two signals. | Design and implement an algorithm to determine the amount of delay necessary to automatically add two signals from different antennas in phase. Also determine the relative amplitudes of the two signals.<br> | ||
====Tools:==== | |||
<b>Software:</b><br> | |||
* MATLAB/Octave | |||
* GnuRadio | |||
* Dttsp | |||
* Sdr-Shell | |||
<b>Hardware:</b><br> | |||
* Dual Softrock Receiver | |||
* Two Antennas | |||
<b>Data:</b><br> | |||
Files of real world data gathered using the above equipment will be provided.<br> | |||
<b>References:</b><br> | |||
[http://www.kkn.net/dayton2008/beam_steering_on_160_meters.pdf Beam Steering on 160 Meters]<br> | |||
[http://k1lt.com/ More K1LT Notes]<br> | |||
[http://johnsogg.blogspot.com/2009/11/installing-gnu-radio-on-ubuntu-910.html Install gnuradio on Ubuntu 9.10 using the package manager]<br> | |||
[http://sdrblog.wordpress.com/gnuradio-installation/ Install gnuradio on Ubuntu 9.10 from GIT repositories]<br> | |||
<b>Other Information:</b><br> | |||
So Gnu Radio will work with Jack, you need to do the following:<br> | |||
<pre> | |||
Edit ~/.gnuradio/config.conf | |||
Add these three lines to the file: | |||
[audio] | |||
verbose = True | |||
audio_module = audio_jack | |||
</pre><br> | |||
The IF of the signals is the sample_rate/4. The bandwidth of SSB signals is about 3 KHz, CW (Morse code) about 200 Hz. The format of the IF signals is I/Q (one on each channel).<br> | |||
This project should be useful with dual antenna receivers to detect the polarization or angle of arrival of a signal, and in general to improve the signals received.<br> | |||
<br><b>Approach to Solution</b><br> | |||
We first downloaded the files with the real world data and used [http://audacity.sourceforge.net/ Audacity] to shorten the data to a workable length to analyze in MATLAB.<br> | |||
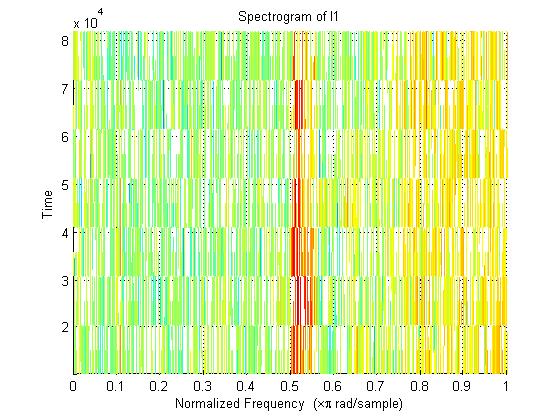
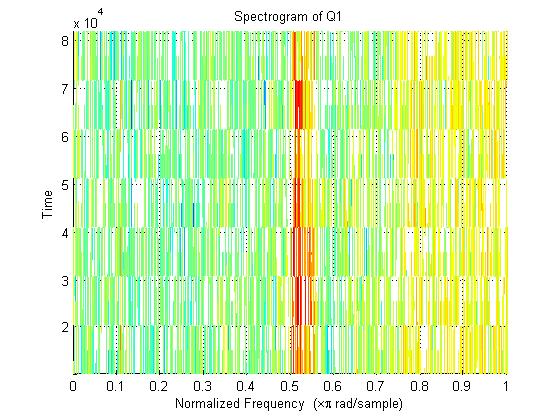
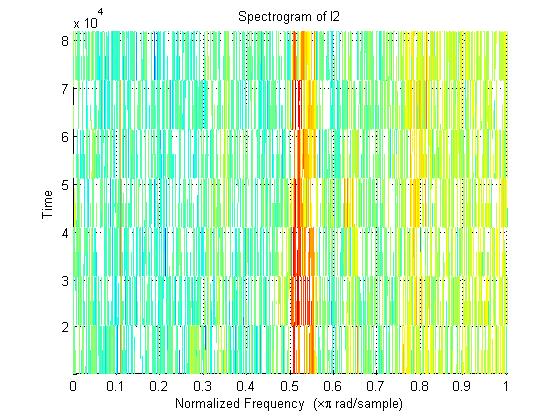
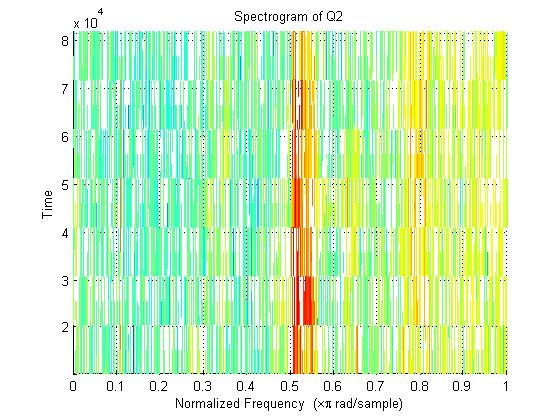
After obtaining a reasonable length of data (~5 seconds worth) we used MATLAB's 'spectrogram' function to create a spectrograph of our signal in order to obtain a reasonable frequency. Here is the code used and the results (shown below): | |||
<pre> | |||
close all; | |||
clear all; | |||
sound1 = 'Alaska_mid-1.wav'; | |||
sound2 = 'Alaska_mid-2.wav'; | |||
sound3 = 'Alaska_mid-3.wav'; | |||
sound4 = 'Alaska_mid-4.wav'; | |||
% Opens wave files above and labels them appropriately | |||
% while also cheking dimensions and scaling the matrices | |||
% appropriately. | |||
[I1 Q1 I2 Q2] = dimCheck(sound1,sound2,sound3,sound4); | |||
% Grabs the sampling frequency of each sound file. | |||
[FI1 FQ1 FI2 FQ2] = freqGet(sound1,sound2,sound3,sound4); | |||
% Creates a spectrograph of each signal while also | |||
% outputing the number of samples (S), the frequecnies | |||
% (F), and the times at which the spectrogram is | |||
% computed. | |||
[S1,F1,T1] = spectrogram(I1); | |||
[S2,F2,T2] = spectrogram(I2); | |||
[S3,F3,T3] = spectrogram(Q1); | |||
[S4,F4,T4] = spectrogram(Q2); | |||
Fn = F1/(F1'*F1); | |||
figure(1) | |||
spectrogram(I1) | |||
title('Spectrogram of I1') | |||
figure(2) | |||
spectrogram(Q1) | |||
title('Spectrogram of Q1') | |||
figure(3) | |||
spectrogram(I2) | |||
title('Spectrogram of I2') | |||
figure(4) | |||
spectrogram(Q2) | |||
title('Spectrogram of Q2') | |||
</pre> | |||
[[Image:Sp_i1.jpg]] | |||
[[Image:Sp_q1.jpg]] | |||
[[Image:Sp_i2.jpg]] | |||
[[Image:Sp_q2.jpg]] | |||
As you can see, it appears that we need to create a bandpass (FIR) filter that will filter around .5 to .57 <math>\scriptstyle \pi</math>rad/s. | |||
Unfortunately, due to time constraints, we were unable to proceed further. However, if time provided, we would have proceeded as follows: <br> | |||
* Create a bandpass (FIR) filter as described above. | |||
* Create a cross-correlation algorithm that would obtain the phase difference between I1, I2 and Q1, Q2. | |||
Latest revision as of 15:38, 16 December 2009
Max Woesner
Class Project - Automatic Antenna Phasing
Team Members:
Joshua Sarris
Kevin Starkey
Max Woesner
Nick Christman
Problem Statement
Design and implement an algorithm to determine the amount of delay necessary to automatically add two signals from different antennas in phase. Also determine the relative amplitudes of the two signals.
Tools:
Software:
- MATLAB/Octave
- GnuRadio
- Dttsp
- Sdr-Shell
Hardware:
- Dual Softrock Receiver
- Two Antennas
Data:
Files of real world data gathered using the above equipment will be provided.
References:
Beam Steering on 160 Meters
More K1LT Notes
Install gnuradio on Ubuntu 9.10 using the package manager
Install gnuradio on Ubuntu 9.10 from GIT repositories
Other Information:
So Gnu Radio will work with Jack, you need to do the following:
Edit ~/.gnuradio/config.conf

Add these three lines to the file:


[audio]

verbose = True

audio_module = audio_jack
The IF of the signals is the sample_rate/4. The bandwidth of SSB signals is about 3 KHz, CW (Morse code) about 200 Hz. The format of the IF signals is I/Q (one on each channel).
This project should be useful with dual antenna receivers to detect the polarization or angle of arrival of a signal, and in general to improve the signals received.
Approach to Solution
We first downloaded the files with the real world data and used Audacity to shorten the data to a workable length to analyze in MATLAB.
After obtaining a reasonable length of data (~5 seconds worth) we used MATLAB's 'spectrogram' function to create a spectrograph of our signal in order to obtain a reasonable frequency. Here is the code used and the results (shown below):
close all;
clear all;

sound1 = 'Alaska_mid-1.wav';
sound2 = 'Alaska_mid-2.wav';
sound3 = 'Alaska_mid-3.wav';
sound4 = 'Alaska_mid-4.wav';

% Opens wave files above and labels them appropriately
% while also cheking dimensions and scaling the matrices
% appropriately.
[I1 Q1 I2 Q2] = dimCheck(sound1,sound2,sound3,sound4);


% Grabs the sampling frequency of each sound file.
[FI1 FQ1 FI2 FQ2] = freqGet(sound1,sound2,sound3,sound4);


% Creates a spectrograph of each signal while also
% outputing the number of samples (S), the frequecnies
% (F), and the times at which the spectrogram is
% computed.

[S1,F1,T1] = spectrogram(I1);
[S2,F2,T2] = spectrogram(I2);
[S3,F3,T3] = spectrogram(Q1);
[S4,F4,T4] = spectrogram(Q2);

Fn = F1/(F1'*F1);

figure(1)
spectrogram(I1)
title('Spectrogram of I1')

figure(2)
spectrogram(Q1)
title('Spectrogram of Q1')

figure(3)
spectrogram(I2)
title('Spectrogram of I2')

figure(4)
spectrogram(Q2)
title('Spectrogram of Q2')
As you can see, it appears that we need to create a bandpass (FIR) filter that will filter around .5 to .57 rad/s.
Unfortunately, due to time constraints, we were unable to proceed further. However, if time provided, we would have proceeded as follows:
- Create a bandpass (FIR) filter as described above.
- Create a cross-correlation algorithm that would obtain the phase difference between I1, I2 and Q1, Q2.


