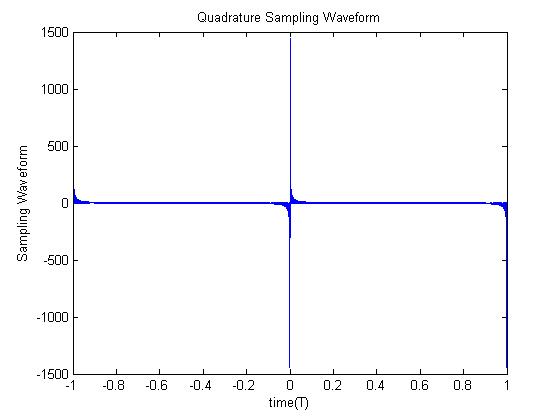
ASN10 - Quadrature sampling demonstration
Assignment was actually done in class by professor.
Classmate Max Woesner has also demonstrated it as shown below with similar code. In Octave we were to plot
clear all;
close all;
sum = 0;
T = 1;
t = -T:0.0001:T;
N = 1000;
for n = 1:N;
     if n==0
          h = 0;
     else
          h = 2/T;
     end
     sum = sum+h*sin(2*pi*n*t/T);
end
plot(t,sum)
title('Quadrature Sampling Waveform')
xlabel('time(T)')
ylabel('Sampling Waveform')
